Ever wonder how much it costs to license anime? Well, thanks to this article on ADV’s bankruptcy proceedings, we now have some idea of what the costs are.
A more interesting question is this: where do those costs come from? Is there some factor that predicts how much companies are willing to shell out?
Using this page to compare with per-volume Japanese sales (22 of the 29 titles are listed there), we can get some idea of whether American and Japanese anime markets actually overlap.
DVD sales data are available for 22 of the 29 shows listed in that article (all except Shin Angyo Onshi, Keroro Gunsou, Jing: Seventh Heaven, Air: The Movie, Comic Party, and Valkyrie). The shows we are analyzing are listed below, in no particular order:
Guyver (2005)
Jinki: Extend
Pani Poni Dash
Utawarerumono
Moeyo Ken
Coyote Ragtime Show
Welcome to the NHK
Nerima Daikon Bros
Air Gear
009-1
Pumpkin Scissors
Red Garden
Chevalier D’Eon
Ah My Goddess s2
Innocent Venus
Project Blue Chikyuu SOS
Magikano
Xenosaga
Tokyo Majin Gakuen
AIR (TV series)
Yamato Nadeshiko Shichi Henge
Moonlight Mile
That’s not a perfect list, but it’s a good start for an analysis. So let’s plug these numbers in and see what they look like.
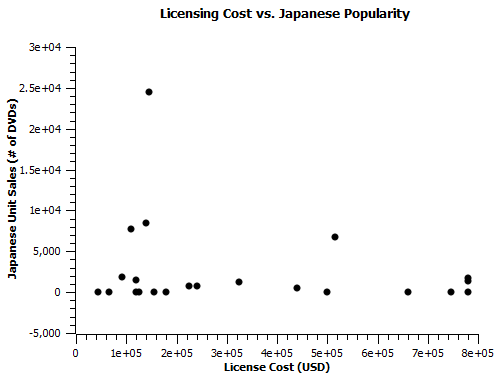
That’s so anticorrelated there’s not really any point in doing the linear fit. Based on just this sample, there seems to be very little relation between what Japanese producers sell and what American licensers pay.
Is there some factor that does predict how expensive a license is going to be? The next most obvious thing would be popularity among English-speaking fans, which I can get a rough estimate of by looking at a show’s myanimelist.net stats.
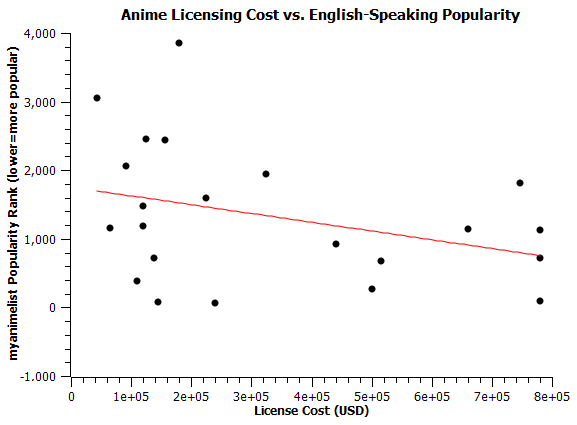
This graph does kind of fit to a linear curve (y=a*x+b), with constants a = -0.0013 +/- 0.0008, b = 1,750 +/- 330. As one might expect, better popularity figures lead to a higher licensing cost, though the scatter is still pretty big.
I was grabbing mal stats anyways, so I decided to take the ratings as well. They’re erratic things, but not meaningless ones, as I’ve discussed.
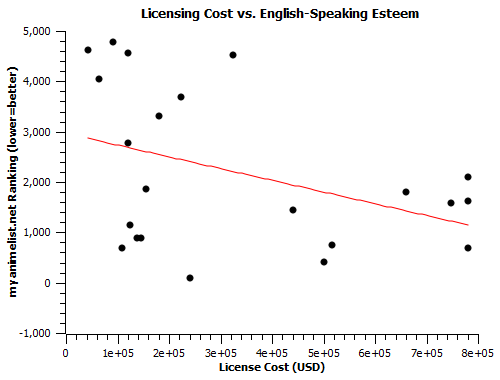
This graph also fits to a linear curve, with constants: a = -0.0023 +/- 0.0012, b = 2,968 +/- 505. It’s interesting that ranking seems to do a slightly better job of predicting license cost than popularity, though I must stress that this is a small sample, and one a couple years old.
So what does this mean? As far as I can tell, these numbers indicate that both English-speaking fanbase popularity and fanbase consensus are somewhat important factors in driving up the price of a license, whereas Japanese commercial success seems to mean squat.
Still, there might be more analysis to be done here, so I wouldn’t trumpet these findings around. It’s just solid enough to publish, but it’s not bedrock by any means.

Pingback: Fun With Numbers: The February 2014 Amazon Experiment (Initial Numbers) | Animetics