So, um, it’s almost well into May and I’ve been molasses with updates, being busy in a good way in life and other hobbies. I kept up the tracking and the data doesn’t change, so I was never particularly motivated to sit down and finish this up. Even though it contains 4 weeks of a new volume (Eva 3.33) selling fairly well, and all. It’s here now, though.
One thing I should mention above the cut: this will be the last of this particular genre of posts. I commited myself when I started that I would keep doing this so long as it didn’t personally cost me any money, and nash info made some changes to the opusdata free trial setup that will make it difficult to keep getting one each week, so actually getting the data each week via a paid account would cost upwards of $200/yr. Not really an amount I’m personally willing to pay for access to an obviously incomplete database (it’d be a different calculus if they actually tracked anime TV shows and less-popular movies, and didn’t outright make mistakes on occasion).
Case in point, the BD data for the last week (the one ending on March 6) outright did not update, staying displayed as the values for the previous week. I’d deal with that sort of human-error hassle for free, but I wouldn’t pay money to handle it.
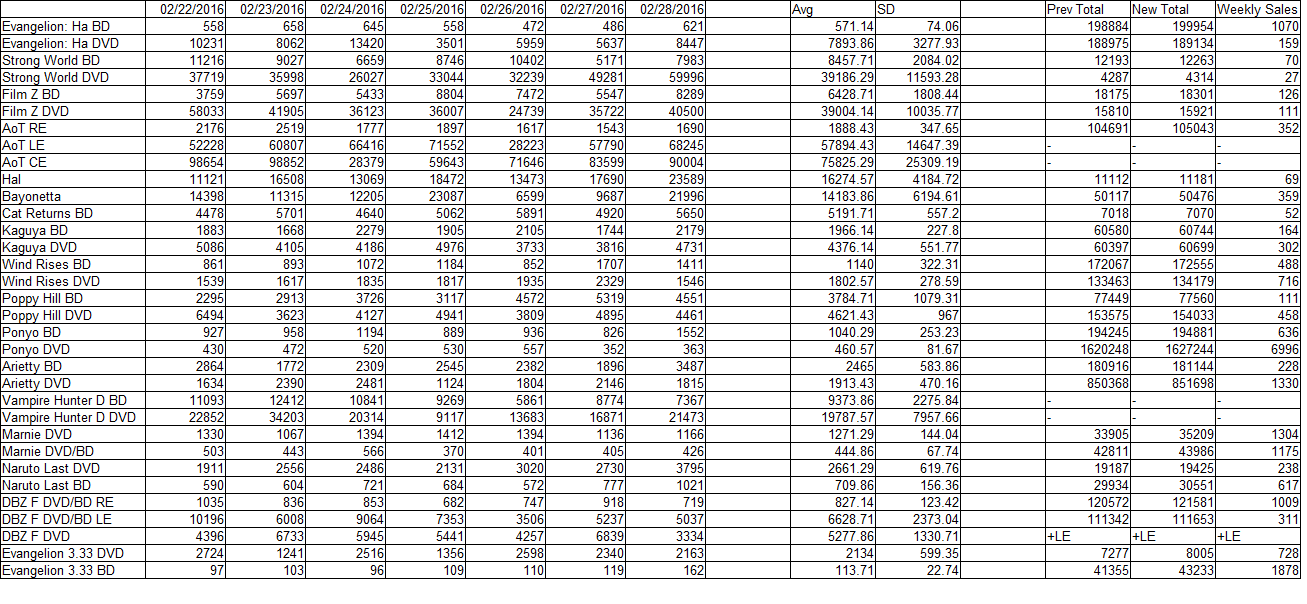
Raw Data:
Week 24 (02/01-02/07/2016):

Week 25 (02/08-02/14/2016):

Week 26 (02/15-02/21/2016):

Week 27 (02/22-02/28/2016):
Week 28 (02/29-03/06/2016):

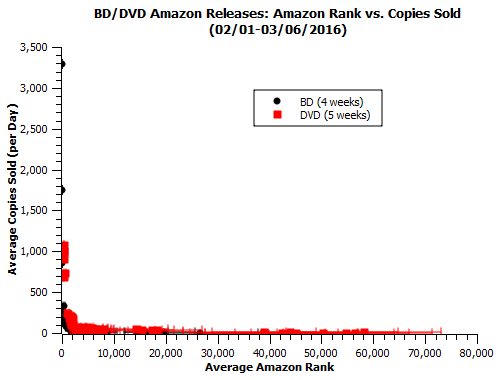
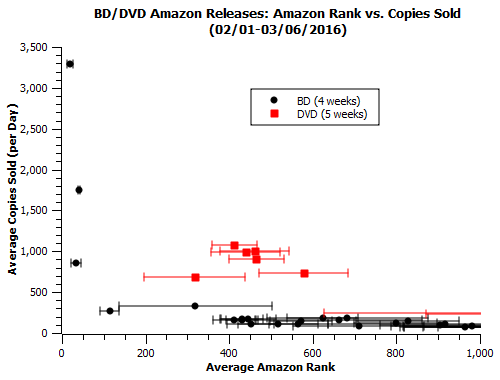
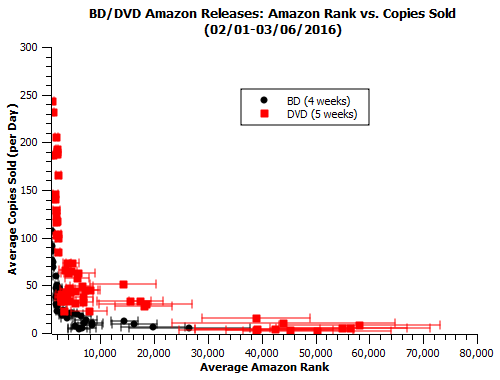
Charted:
(Below, I show the same data plotted 3 times, with differently-scaled axes to showcase different parts.)
Formula Recap:
#10k-#40k: S=10-(R-10000)*(9/30000)
#2k-#10k: S=30-(R-2000)*(20/8000)
#1k-#2k: S=70-(R-1000)*(40/1000)
#500-#1k: S=220-(R-500)*(150/500)
#200-#500: S=250-(R-200)*(30/300)
#150-#200: S=800-(R-150)*(550/50)
#100-#150: S=1000-(R-100)*(200/50)
#50-#100: S=1300-(R-50)*(300/50)
Sales vs. Expectations:
Week 24 (02/01-02/07/2016):

Week 25 (02/08-02/14/2016):
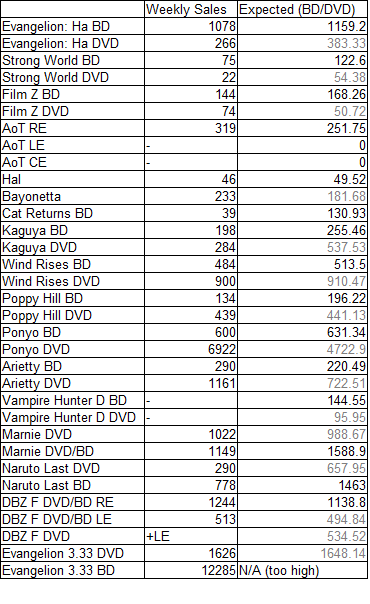
Week 26 (02/15-02/21/2016):

Week 27 (02/22-02/28/2016):

Week 28 (02/29-03/06/2016):

Comments:
-Since Eva 3.33 represents the second release that spent a couple of post-launch weeks at a rank better than #50, I can combine it with the data from DBZ:F (Oct26-Nov8, 2015) to get a rough guess at the peak ranks a bit better than the formula formally covers:
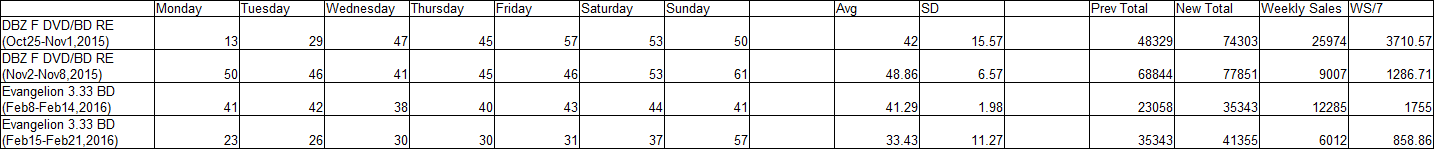
The average of the average of ranks is #41 and the average amount of copies sold per day for all of the releases is 1900. There’s a slight extension, *maybe* accurate to about a factor of two. You see something going into ranks below that, and you’re looking at uncharted territory. The values of top ranks vary heavily depending on the competition.
-Since creating the core formula on display above, I haven’t seen a lot of reason to tweak it. It’s fairly accurate overall (as the success of the batch of predictions above underscores) , the cases where it’s off by a factor of two or more are fairly evenly split between over/under misses, and there’s no clear correlation between other potential indicators and whether a miss is too high or too low. So I’m keeping the rest, and that, combined with the addition of a #40 rank baseline, is a personally satisfying end result.
By all means, use the below formula however you like:
Formula (Final Version):
#10k-#40k: S=10-(R-10000)*(9/30000)
#2k-#10k: S=30-(R-2000)*(20/8000)
#1k-#2k: S=70-(R-1000)*(40/1000)
#500-#1k: S=220-(R-500)*(150/500)
#200-#500: S=250-(R-200)*(30/300)
#150-#200: S=800-(R-150)*(550/50)
#100-#150: S=1000-(R-100)*(200/50)
#50-#100: S=1300-(R-50)*(300/50)
#40-#50: S=1900-(R-40)*(600/10)
