The month of February is over, and that means I’m done with something I started back in December – an experiment tracking the amazon rankings of several R1 February releases. It should be noted that the original sample these ideas are drawn from is a very tiny one (11 total releases), so using the word “conclusions” to refer to any of this would be serious hyperbole. But there are a number of interesting threads that popped out of the data, that will hopefully inform my observations in the coming months and be either validated or falsified by a larger sample of data for March.
The full data sample, such as it is, can be found here. Or, in graphical format:
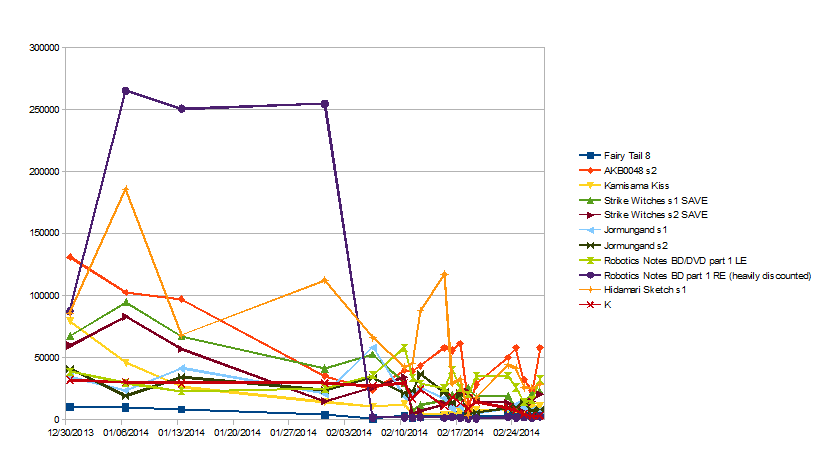
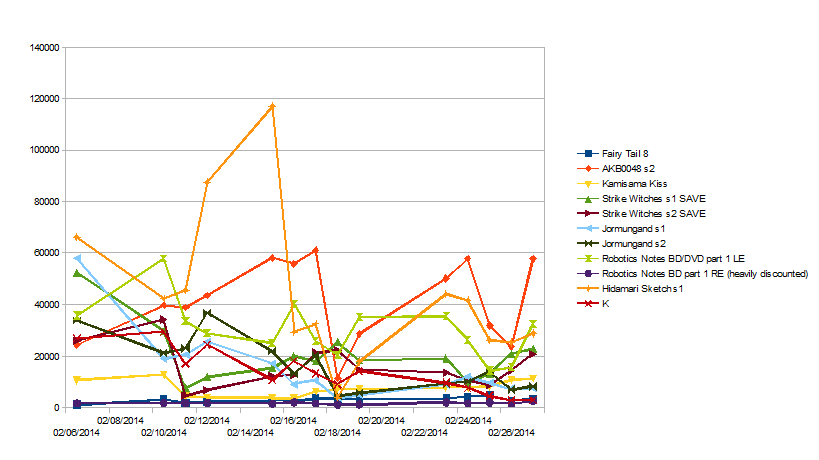
Because of how weak the initial rankings for the RE of Robotics Notes part 1 and Hidamari Sketch were, that’s not an entirely legible scale for the month of February. Here’s the plot for just the month of February:
The Potential Narratives
1. Release days on a given week may tend to boost the sales of titles coming out in other weeks.
It’s not an absolute trend, but it does seem like the release days (every Tuesday, or Feb 11th, 18th, and 25th) tend to yield a boost for most titles on the list, not just the titles coming out on that particular day. If not just a coincidence, this is easily explicable as a foot-in-the-door effect; people who buy box sets of anime aren’t just buying one over their entire lifetime. If they’re interested in multiple series, it makes sense that they’d be more likely to drop $40 on a series while already on the site to buy another one.
2. With the right price, Robotics Notes sold a lot of copies.
For most of its solicitation period, even long before the official release date, Robotics Notes’ regular edition was 60+ percent off. This was likely at least partially responsible for some pretty fantastic rankings it put up; it spent pretty much the entire month ranked at 2500th or better, a claim not even the 8th release of ongoing juggernaut Fairy Tail can make. Expect to see something similar out of the almost as heavily discounted Psycho-Pass in March.
3. Even with the SAVE discount, re-releases like Strike Witches have a hard time matching most new titles.
Aside from Sentai releases AKB0048 s2 and Hidamari Sketch, Strike Witches’ discounted re-releases were the worst performers of the sample. This is not to demean their worth (it costs Funimation practically nothing to produce SAVE editions), but it would suggest that a low MSRP isn’t enough to put a rerelease in a better position than new releases.
Note: Because of the probability that they work on different economies, Strike Witches and RN’s LE are excluded from subsequent plots comparing amazon ranks with other measurables.
Note 2: Said amazon ranks will be averaged over a 3-day period centered on the release date and plotted logarithmically; while it would be foolish to assume too much similarity with their Japanese counterparts, it’s reasonable to assume the general principle amazon stalker uses that the difference between 2000th and 3000th is more meaningful than the difference between 12000th and 13000th, if US amazon rankings are at all top-heavy.
4. MAL ranking and peak amazon ranking are basically uncorrelated.
![]()
Fairy Tail and Robotics Notes are the two furthest apart in rank on the sample and performed the best. Remove those two, and you get a chart with points in all 4 corners. While everything in this column is ultimately pending the March data, this one is one I would bet on to hold up.
5. MAL popularity and peak amazon ranking are perhaps strongly correlated.
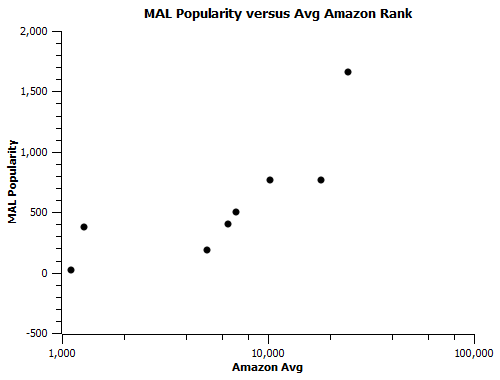
The top 5 titles picked up the top 5 ranks, and there’s a pretty clear progression up the ladder as things get less popular. I don’t think anybody who’s reasonably involved in the community would find it ridiculous to suggest that Fairy Tail was the most popular series among those listed, but the fact that the rest (with RN as the recurring discount-exception) follow that pattern is quite suggestive.
To be clear, the most popular show on myanimelist does not equal the best show. But there is a sentiment among a number of people I’ve talked with that the numbers on it have no connection to reality. This is generally used as part of a more general dodge of the idea that a range of opinions other than one’s own are just as valid as one’s own.*
6. A positive C-score does not predict success, but a negative C-score may predict failure.
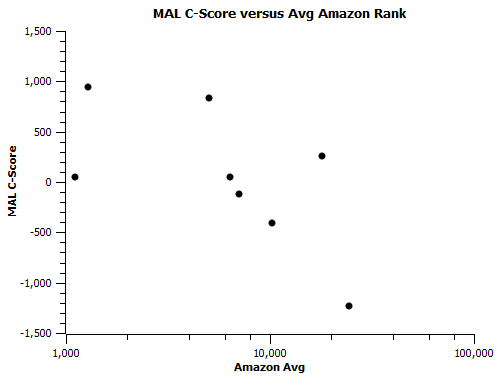
This is more likely a result of popularity being important and ranking being not important. If the latter is functionally random, then it’s possible to sell anywhere with a -200< C-score (i.e. while being as popular or more than rank suggests), but not with a -200> C-score (i.e. while being less popular than a show’s rank would suggest). There is almost certainly a point worth making in this one if it holds up through March.
7. Low Japanese unit sales seem to correlate with strong R1 amazon ranking.
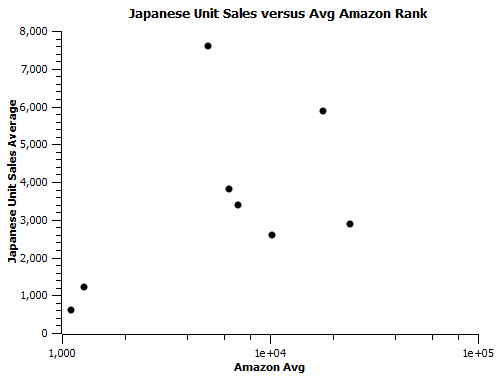
…But expect this correlation to be blown out of the water once Psycho-Pass (average 8474) solicits. Upotte (average 1269) may well fill in the remaining corner with its already-respectable preorder figures. If they end up not doing so, then there may be some room for discussion.
8. Even with all the time in between, the initial ranking was somewhat indicative of the final ranking except in the exceptional RN case.
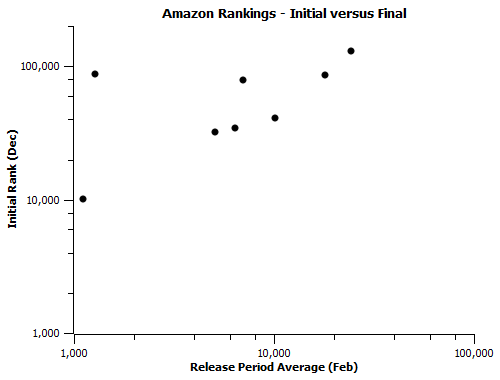
Take out the RN RE datapoint in the upper-left corner (it wasn’t discounted when the initial data was taken), and the correlation of initial and final ranking is fairly straightforward, though not entirely linear. This suggests it might be somewhat fair to cite the current amazon rankings of releases scheduled a couple months in advance as a relative measure of interest.
*In my experience, a lot of fans tend to be parts of small communities where proximity to other people with strong opinions on a show colors their views of it (for both better and worse). For a show like Initial D or Star Driver, it makes a great deal of difference whether someone’s first experience with a show is in a crowd heckling it, in a crowd loving it, or in their own desk chair, to say nothing of differences in personal taste. That people call shows objectively, indisputably good or bad based solely on their experiences with it is a symptom of their failing to recognize this. I like having myanimelist rankings as a counterpoint to the whole idea; pretty much every show gets a 10/10 from some percentage of its viewers, which boosts the idea that a show’s quality is a topic for discussion, not a settled question.

Pingback: Fun With Numbers: April 2014 Amazon Data (Initial Numbers) | Animetics
Pingback: Fun With Numbers: Amazon Rank Progression for US Releases (March 25) | Animetics
Pingback: Fun With Numbers: March Amazon Data and Ambiguity | Animetics