Having 2-3 times as many datapoints does usually make things more clear, except when it doesn’t. Adding March releases to the set of amazon rank data I’ve been gathering did help fill out some of the plots, but it also brought me face-to-face with some very real points I overlooked last time around. At any rate, it’s been an informative month of data gathering (table’s here, if you’re interested). This post is mainly an update on where I stand right now on this cf of an analysis project, with a recap of points addressed last month, a summary of the other things that came up, and an *extremely* rudimentary sales estimation model.
Original Point 1. Release days on a given week may tend to boost the sales of titles coming out in other weeks.
-I can point to release weeks where rankings got worse for about half of the titles. This might still be an effect, but if so it’s a small one, not really worth addressing when there’s boatloads of other numbers to crunch.
Original Point 2. With the right price (50%+ off), Robotics Notes sold a lot of copies.
-It’s possible to rank really high without such a discount; Bleach and Fairy Tail both had less significant discounts and peaked under 2500. But Psycho-Pass and One Piece, the only other series getting that tier of discount this month, were 3 of the 4 strongest releases numbers-wise (of course, with less gross profit per sale). By the by, part 2 of RN itself put up fairly respectable numbers at full price.
Original Point 3. Even with the SAVE discount, re-releases like Strike Witches have a hard time matching most new titles.
-The only rereleases that performed particularly well were Yugioh, Nadia, Ranma, series with huge fanbases left over from earlier eras. Of course, that doesn’t make the others bad ideas; they’re very close to free to produce.
(Note: From here on out, I’m talking about first-time releases only.)
Original Point 4. MAL ranking and peak amazon ranking are basically uncorrelated.
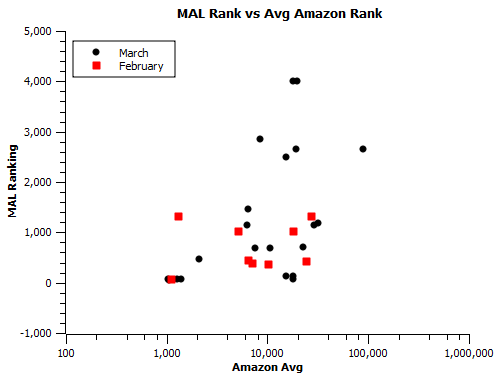 That is interesting, and a somewhat different story. Adding in all those datapoints, and in the process putting a lot of weak-rank datapoints on the plot, seems to show that it’s difficult to put series ranked that highly in the absolute peak of the sales spectrum, at least. I’ll wait on calling this one until there’s more data available.
Original Point 5. MAL popularity and peak amazon ranking are perhaps strongly correlated.
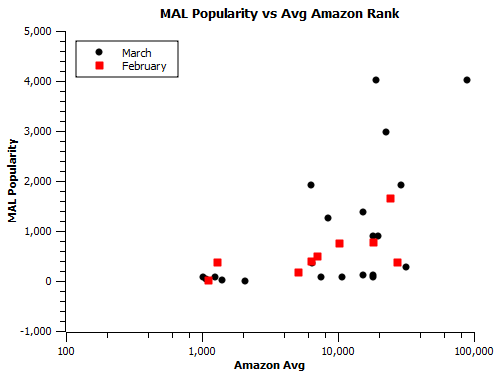 On the other hand, mal popularity continues to look like a strong qualifier. While it’s possible for series with similar levels of myanimelist popularity to produce varying results (Sakurasou vs Accel World [link] as one example), the peak of the amazon ranks consist exclusively of shows in the top 500 of that index.
Original Point 6. A positive C-score does not predict success, but a negative C-score may predict failure.
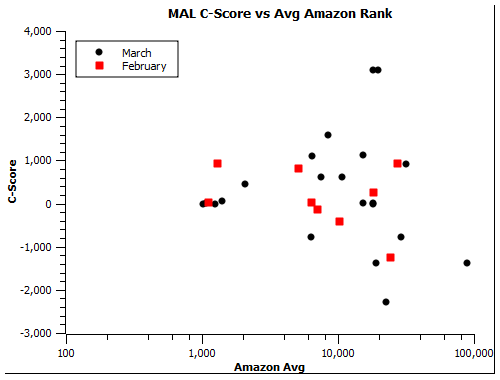 It’s still not conclusive, but Mardock Scramble was the only series to really beat the odds here and peak with a rank better than 10,000th, and movies are lower-cost items. There seems to be a bit more weight to the idea things less popular than their ranking suggest they “should” be don’t really sell well in the US.
Original Point 7. Low Japanese unit sales seem to correlate with strong R1 amazon ranking.
 Between the discounted One Piece, Psycho-Pass, and Accel World, which did well despite its split release status, this plot looks a lot more random, with all sorts of different peaks for all sorts of unit sales averages.
Original Point 8. Even with all the time in between, the initial ranking was somewhat indicative of the final ranking except in the exceptional RN case.
At least in the case of one-week-out rankings, yes it was. Regardless of which type of release a series was, ranking high early seemed to correlate well with better rank peaks. More generally, releases rarely “switched places” unless one went on sale. This implies that the people preordering and the people buying on release day come from the same group.
—
Beyond helping to clarify some of the ideas from that first-glance analysis, having more releases and more types of releases helped shed a little more light on how complex the market is. There are a couple of factors beyond core popularity (with myanimelist as a proxy for said popularity) that reared their head this month as potential influences. To separate these out, there’s not much to do but wait an inordinate amount of time and keep taking data:
-Companies might matter. Sentai vs Funi vs Aniplex is a discussion that happens among people who buy R1 releases. The more reliable brand, whichever one that people have had more positive experiences with in the past, probably has slightly higher chances of getting their release bought from the same pool of buyers.
-The presence or absence of dubs might matter, insofar as Sakurasou and Accel World are a healthy point of comparison
-DVD/BD splits for titles that have them can be fairly even, unlike the JP market, could matter.
-Discounts almost certainly matter, though the biggest 50%+ ones are almost exclusive to Funimation releases. It might be interesting at some point to compare the discounts offered by different retailers, and see if lower prices at other retailers (Right Stuf and RACS both do have rank lists, iirc, though those anime-only retailers are less likely to have a steady baseline) could be driving amazon sales down.
—
Below I describe a model estimates of how much the shows listed sold over the tracking period, with high-low endpoints given. This is not a serious tool, but a rough draft which I plan to revise over time. Being as the majority of US anime sales are not formally reported, this model comes with a number of caveats. I would not be posting it if I believe it had no connection to reality, but the results should be analyzed with caution. Below are a number of specific points I could see causing significant changes in the model, which are in the same post as the estimates because they need to be read to give the predictions proper context:
1. I assume that, over a large period of time, the non-top-5 bluray places on amazon will generally fall within a certain corresponding range of the TV/Movies ranking.
2. I assume that, over a large period of time, the non-top-5 bluray places on the home video sales charts will fall within a certain corresponding range of sales.
These two will probably be rectified in several months after I have sets of both items of data for a corresponding week, as well as home video sales data for a few more months (currently, most of my home video data is from during holiday season). Specifically, I hope to address the point that not all series ranking in the top 20 stay there the whole time, and that a week spent in the #15 spot is more valuable than a day spent in the #15 spot.
3. I assume that amazon’s rankings are a good approximation of the US home video market at large.
4. I assume that amazon’s rankings represent US anime sales about as well as they represent home video sales at large.
5. This model is meant to fit to the lower end of the sales spectrum, so it likely vastly underestimates releases ranking 10th or higher in TV/Movies. (Not that anime ever pulls that off over here.)
6. This model extrapolates from data extending out to 200-300th place in TV/Movies into places in the 10,000s or above. I can’t be at all certain that the lower end of the rankings corresponds to this power law exactly. I decided not to add a flat correction term, though.
7. I fit the available amazon+HV BD sales data to both exponential, linear, and power decay, and chose the power fit because, even within the bounds of the BD top 20, the exponential fit notably underestimated the low end (which is what I’m really interested in). In general, I would expect that the effects lost in going down one additional number in rank would be less significant over higher values; there are more B-list films than A-listers, and more C-list films than B-listers, due to both the lower cost of production involved with less-popular films and the number of A-listers ranking on 3-month-long tails.
8. I assume a series change in rank over the course of a single day is roughly irrelevant, given the error bars on the rest of my sample.
—
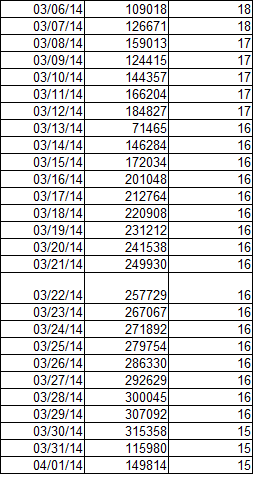
In fitting this model, I plotted the average amazon ranking of the top 20 Blu-Ray titles from March 28-April 2nd and average weekly home video sales of the top 20 ranking Blu-Ray titles for the month of December (publicly available via The Numbers, messily archived here). I averaged each value and discarded any slot for which the standard deviation exceeded 50%, which ended up being the top 7 slots.
In order for a model to adequately represent existing data, it needed to fit two conditions; first, to fall within the error for the known home video sales values, and second, to be close to one and zero daily sales at places of 100,000th and 150,000th, respectively. (The second condition comes via my observation of Aria the Natural part 2, which seemed to indicate that fact.) The second condition disqualified exponential and linear fits, which would approach zero or become negative far too quickly. What I ended up with was a series of power laws. Due to the inexact nature of the high-end data, assuming the most mathematically sound fit would automatically be accurate is a stretch. Instead, I fit a series of power laws of the form a*x^b, with b ranging from -0.5 to -1.5, and picked out the one which most closely showed a contrast between 100,000th and 150,000th place.

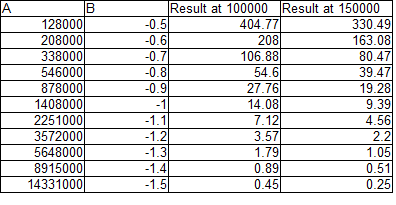 The model of choice for the moment is S=5,648,000*R^-1.3, where S is daily sales and R is daily rank. Estimated sales based on this model calculated by totalling the values for each day over the March tracking period are given in the figure below, along with the low and high endpoints of the range they may fall within if the model is somewhat accurate.
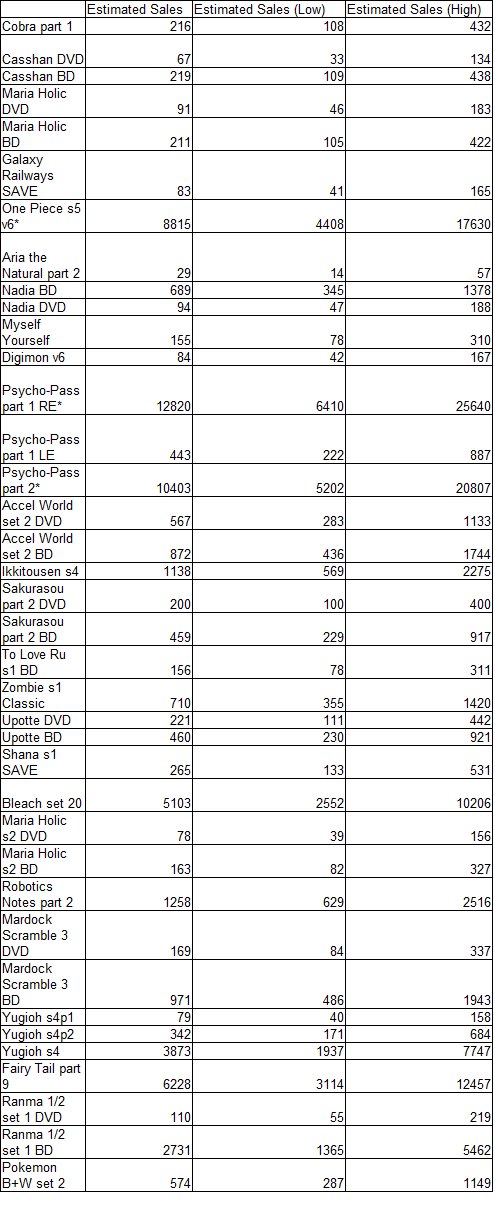 I have no comment on the above numbers at this time, because, as I have stressed, this is currently the most rudimentary of rudimentary fits.

Pingback: Fun With Numbers: Pays to Shop Around | Animetics
Pingback: Fun With Numbers: Berserk’s Third Movie Offers an Upper Bound on US Amazon Sales Projections | Animetics
Pingback: Fun With Numbers: Updated US Amazon Formulae | Animetics
Pingback: Fun With Numbers: May 2015 US Amazon Data (Initial Numbers) | Animetics