Since late February of this year, I’ve been tracking the daily ranks of various anime releases on US Amazon to see if they could be used to get an idea of how releases were selling in the US, since that data is sparsely available for modern titles (especially unpopular ones). In March, I made my first stab at a formula which might tie thos edaily ranks to sales totals. In May, I realized that first model was based primarily on Holiday season sales charts and thus severely overestimated the market, and introduced a simpler one making use of more data. That model seemed for a time like it would be serviceable, pegging the sales of DBZ’s season 3 BDs to within 20%, but then it overestimated Attack on Titan part 1 by a factor of 3. Since I had no other test cases for my model available for the next few months, I was able to put off refining that model, but with data for the second part of Attack on Titan, the surprisingly successful Steins Gate rerelease, and DBZ Battle of Gods set to come out over the next few weeks, it’s a good time to use the data I’ve gathered to try and test a different model.
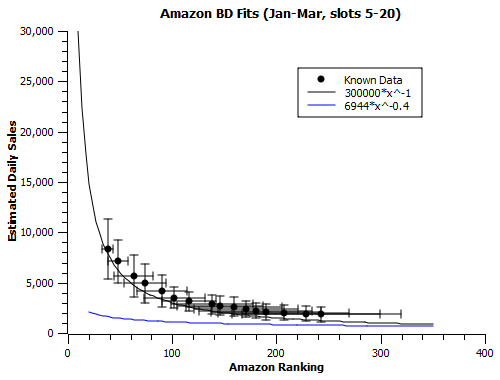
The fact that Attack on Titan was so heavily overestimated pointed to a possible way forward – perhaps my initial x^-1 power law was too steep. While it holds to reason that there should be some inverse dependence on ranking, maybe the difference between 100 and 200 is less significant than it seems. Rather than guess at what sort of ratio would be necessary here, I cheated and used the chart totals for both AoT p1 (11,748) and DBZ s3 (7472) to determine the ratio of final values I should be getting when I plugged in their respective rank data (~1.57). This corresponded to a power law with a slope around x^-0.35.
However, there were two problems with a slope this shallow. First, there’s no way to get a power law that only drops off with the cube root of rank to produce AoT’s values and then drop off to zero at the Aria limit of zero (or at least very few) copies sold ranks 120,000th or worse. At best, you wind up with about 90 predicted sales per day in that range. To correct for this, I made the slope of the power law slightly steeper (x^-0.4) and introduced a correcting term of -60 copies per day. This yielded a final formula, after normalization, of:
S=(6944*(R^-0.4))-60
Where R is the daily amazon rank and S is the estimated number of copies sold.
Secondly, it’s impossible to do the above without basically casting aside amazon toplist data – it’s way outside the acceptable error bars on this graph:
 I’m assuming for the moment that anime is much more amazon-heavy than standard releases on amazon (with less of a brick-and-mortar presence to add to sales). I could be wrong, and this makes me nervous, but it’s not like we’re flying blind here – if the data that comes out in the next couple of weeks shows this formula is a huge lowballer, then it’s just another bit of information to deal with in building a better formula.
At any rate, here are the predictions for the first-week sales of various high-ranking volumes that we should get data (or at least thresholds) for in the next several weeks, calculated via applying the above formula using gathered rank data:
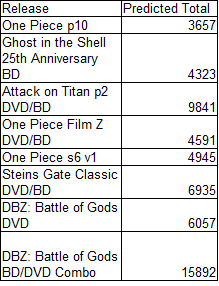 We’ll see how this goes.

Pingback: Fun With Numbers: Attack on Titan Part 2 Sold 10,677 Copies on Week 1 | Animetics
Pingback: Fun With Numbers: One Piece Film Z Sold 6,199 Copies on Week 1 | Animetics
Pingback: Fun With Numbers: Dragonball Z: Battle of Gods Sold 86,735 Copies on Week One | Animetics
Pingback: Fun With Numbers: Dragon Ball Z: Battle of Gods Sold 17,247 Copies in Week 4 | Animetics
Pingback: Fun With Numbers: April 2015 US Amazon Data (Initial Numbers) | Animetics