The Attack on Titan TV Series Has Sold at Least 200,000 Copies in the U.S.

…And the Final Fantasy XV opened with 62,727 BDs sold (I didn’t track it because it’s not under amazon’s “Anime” tag, but that’s obviously not bad).

There’s new information on the U.S. anime sales long-term front. The BD sales chart for the week ending in October 9, 2016, is out, carrying with it a couple of pieces of juicy info buried beneath probable errors in Nash Info Services’ quality control.

Continue reading

Fun With Numbers: Long-Tail Figures and Uncharted Territory

Recently, via the creation of a second OpusData trial account, I was able to acquire some new data that sheds light on how several newer US anime release performed in the long term. This includes 5 releases (Attack on Titan: Part 2, One Piece Film Z, The Wind Rises, Evangelion: Ha, The Tale of Princess Kaguya) for which we have at least one week of sales data already, plus 4 releases (Momo, Hal, Bayonetta, The Cat Returns) that came out in the 12 months and failed to chart once. Excluding Evangelion: Ha, and The Cat Returns, all of these titles came out between September and November 2014, so they’re roughly comparable in terms of the amount of time since release they’ve had to accrue new sales.

[Note: OpusData and TheNumbers, where I usually get what hard US video sales data I post, are owned and operated by the same company, Nash Info Services.]

The info that can be gleaned from them is interesting, but let me just say right now that I’m really happy about the clerical error that logged Attack on Titan’s second set as a movie, and hence trackable long-term in the Opus database.

Continue reading

Fun With Numbers: Precedent for Long Tails in US Anime Sales Totals

Though there are plenty of sources out there from which one can learn about it, the inner workings of the US anime market are often characterized by what we don’t know. I track US anime releases on amazon because I’m curious about said market. That curiosity has several points of origin, but I chasing after one primary question; do fans buy the titles one would think they buy, to the extent one would think, from their presence on social media?

But tracking US amazon rankings is only useful insofar as these rankings have the potential to correspond to real sales data. And even that’s not particularly useful if the “real” data has the potential to be off by a factor of 100 due to unpredictable factors. One obvious potential contributor to the potential for underestimations are long tails, the combined contribution of totals from all weeks the release doesn’t make the threshold on a given set of charts. These are a very familiar foe when it comes to trying to compare sales figures, and are definitely worth addressing. There’s plenty of reason to believe long tails might be a factor in the US home video market – per-episode prices are much lower than they are in Japan, and thresholds are much higher.

I previously used a trial account to access the lifetime home-video sales totals of various anime movies in Nash Information Services’ OpusData database. Recently, I found out that the companion website to the service TheNumbers, stores years worth of back-data on its weekly charts, though its thresholds are, by design, severely limited compared to those measured on OpusData. Using those charts, it was a trivial task to go back to each movie’s release date and check how much of its lifetime total was accumulated while it was on the BD20/DVD30 toplists. Note that 2 of the 12 movies in the original sample never made said toplists and thus cannot be compared. Results are shown after the break.

Continue reading

Fun With Numbers: Attack on Titan Part 2 Sold 10,677 Copies on Week 1

Didn’t even take 12 hours. As expected, Attack on Titan’s second set ranked on the US charts, selling a little over a thousand fewer copies in the first week than set 1 did, but still putting up solid numbers.

USBD_09_28_2014

This time, my guess (9841 copies) was only off by 8 percent. That qualifies as a pretty successful test. If the S=(6944*(R^-0.4))-60 formula can ballpark the rest of this list successfully (at least, for the ones that chart), I think we may have a keeper.

Fun With Numbers: Updated US Amazon Formulae

Since late February of this year, I’ve been tracking the daily ranks of various anime releases on US Amazon to see if they could be used to get an idea of how releases were selling in the US, since that data is sparsely available for modern titles (especially unpopular ones). In March, I made my first stab at a formula which might tie thos edaily ranks to sales totals. In May, I realized that first model was based primarily on Holiday season sales charts and thus severely overestimated the market, and introduced a simpler one making use of more data. That model seemed for a time like it would be serviceable, pegging the sales of DBZ’s season 3 BDs to within 20%, but then it overestimated Attack on Titan part 1 by a factor of 3. Since I had no other test cases for my model available for the next few months, I was able to put off refining that model, but with data for the second part of Attack on Titan, the surprisingly successful Steins Gate rerelease, and DBZ Battle of Gods set to come out over the next few weeks, it’s a good time to use the data I’ve gathered to try and test a different model.

Continue reading

Fun With Numbers: Attack on Titan’s US Release Sold 11,748 Copies on Week 1

OpusData BD data for the week ending in June 8th is now publicly avaialble, and since the BD/DVD combo packs are counted as BD releases (as they were for the Fairy Tail movie), that means we have sales figures for Attack on Titan’s part 1 release. The release, which performed the best on amazon out of any US release I’ve tracked in the past 6 months. Assuming the BD/DVD combo packs were counted the same way this company has previously done, Attack on Titan was the 14th best release among US BD content on this week, selling 11,748 copies.

AoT_wk1_us

This actually represents a severe underestimation for my rough-fit model, which pegged it at around 30,000 copies. While it underestimated DBZ season 3’s first week by 20%, this represents an overestimate of more than 60%. It’s possible that the series’ airing on network TV during solicitation made it more of an amazon-heavy title. Most likely, though, this underscores the fact that the model is still rough and prone to error. I’ll be tweaking the model a bit in the next couple of days to see if I can get a model that less severely overestimates this series while still covering the other two points of confirmed data (DBZ s3 and Aria the Natural). I should have at least one more chance to test that model when the series’ second part comes out in late September.

Fun With Numbers: May US Amazon Data and Attack on Titan’s Nonzero Shot at the US BD Charts

Amazon data for the series I was tracking in May is here. It’s largely unremarkable; only 4 series spent prolonged periods of time ranking in the quadruple digits, and 3 (Yugioh, Fairy Tail, and DBZ) were long runners.

More interestingly, Attack on Titan started soliciting this week. If my calculations are correct, it has a very real chance of snagging a spot on the BD charts in the US, becoming the first anime release to do so since I began tracking series this February.

Note: While what follows is based on data I have gathered, it is largely speculative and makes a number of assumptions, among them that amazon performance is indicative of the BD/disk market in the US and that anime does not perform significantly differently from other types of titles in similar places in these rankings. These may well be way, way off, so take it with a heavy dose of skepticism.

Continue reading

Fun With Numbers: June 2014 US Amazon Data (Initial Numbers)

Here’s the usual infodump post of initial numbers for the series whose June amazon ranks I’ll be tracking, gathered from this list of upcoming releases. As before, May data is still being collected and will be posted when that’s done in about a week.

Continue reading

Fun With Numbers: Anime as Manga Advertisments in 2013

The commercial impact of anime goes well beyond its disk sales. Manga may sell to more people, but anime is extremely visible, airing on TV (albeit often late at night) and propagating around the internet at a very rapid pace. This visibility very often can lead to an increased strength of the franchise in general, propping up sales of print material, figures, and any various other related goods. Sometimes, anyway. 2013 was no exception, and saw a number of manga adaptations have anywhere from minimal to explosive effects on the sales of their source material.

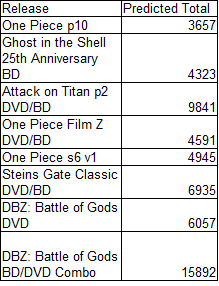
I collected the manga sales history, including thresholds for series which charted sporadically, on this doc, and plotted it below. Note that these sales are not total, but the total number reported in a roughly fixed time period. Comparing sales tail length is a whole other issue, and I’m trying as much as possible to compare like figures.

One important difference from similar breakdowns of 2011/2012 series is that here I’ve opted to use the total sales from a series’ first 2 weeks of release (the highest reported total in that time interval), to attempt to minimize the effects of a bad split in creating artificial variations. It’s still an issue either way, but the difference between 9 and 14 days is a lot less than the difference between 2 and 7 days.

Two important series-specific notes prior to the plots. First, Maoyu is plotted here, in the manga section, because the manga charts more consistently than the light novel did and, more importantly, has available data from both before and after the anime aired (the LN ended just prior to 2013). Second, I can’t parse impact for series that don’t have at least one volume which released after the anime began to air. I thus will not be covering Servant x Service here, though there is data available. I will cover it in an addendum post come September when volume 4 has been out for 2 weeks.

Continue reading

Fun With Numbers: Correlation Coefficients for Manga Sales Boosts and the Kickstarter Analogy

Let’s say, for the sake of argument, you’re a fan of Attack on Titan. You watched the entire show as it aired and can’t wait for more of it. What if, tomorrow, a Kickstarter went up for a 12-episode second season of the show. How much, without knowing the reward tiers, would you give? $1? $10? $20? $50? $100 (like the U.S. disks for season 1 as a whole will likely cost)?

I’d imagine that, depending on just how much they enjoyed AoT, most people would answer with a number within their price range. Given the popularity of the show, such a project would be a fairly safe bet to break the current record for animation projects on the site (currently Bee and Puppycat’s $872,133).

But let’s make a key change to this project. Let’s suppose that, instead of a give-what-you-can model of pricing, this hypothetical Kickstarter only allowed pledges at or above $500 level. Even for a series with a lot of enthusiastic fans, I’m willing to bet that turns some of them off. Even if that $500 level includes a meet-and-greet with the anime’s entire cast and signed copy of volume 1 of the manga, that’s just more than what many people are willing (or able) to pay. And that is the crux of the matter when it comes to discussing who buys anime.

Continue reading