Let’s say, for the sake of argument, you’re a fan of Attack on Titan. You watched the entire show as it aired and can’t wait for more of it. What if, tomorrow, a Kickstarter went up for a 12-episode second season of the show. How much, without knowing the reward tiers, would you give? $1? $10? $20? $50? $100 (like the U.S. disks for season 1 as a whole will likely cost)?
I’d imagine that, depending on just how much they enjoyed AoT, most people would answer with a number within their price range. Given the popularity of the show, such a project would be a fairly safe bet to break the current record for animation projects on the site (currently Bee and Puppycat’s $872,133).
But let’s make a key change to this project. Let’s suppose that, instead of a give-what-you-can model of pricing, this hypothetical Kickstarter only allowed pledges at or above $500 level. Even for a series with a lot of enthusiastic fans, I’m willing to bet that turns some of them off. Even if that $500 level includes a meet-and-greet with the anime’s entire cast and signed copy of volume 1 of the manga, that’s just more than what many people are willing (or able) to pay. And that is the crux of the matter when it comes to discussing who buys anime.
The above is more than just a hypothetical. The decision of whether to give a piece of animation $500 or $0 is a choice that Japanese buyers of anime face every season when they decide what series to buy. Anime in Japan comes out in 2-3 episode volumes, which generally cost around 7000 yen and get released at a 1-per-month clip (3 times as fast as the fastest weekly manga); in order to buy the whole series, you basically have to pay for all of the 6-8 individual volumes over a fairly short span of time. And that totals to about 40000-60000 yen for a series.
This isn’t to say that there aren’t more marginal ways cash-strapped Japanese fans of a particular show can contribute. They can buy the manga or light novels, which they very often do if they’re available. Other goods, such as figures, character song collections, and character-imprinted goods, can and do make a marginal difference in the ledgers of the production committee. However, if fans in Japan actually want to own the anime proper, they have a choice of paying $500 or $0.
Many fans do pay up. Others don’t pay anything. But some take a middle course, and that’s where things get interesting. While Attack on Titan’s disk releases have averaged in the neighborhood of an astounding 54,000 disks per volume, its effect on the manga was even more explosive. While the manga’s 9th volume sold 435,000 volumes in its first 2 weeks in December of 2012, the manga’s 11th volume sold 764,000 volumes in its first 3 days in August of 2013. Factoring in longer term sales, it would be at most a slight underestimate to say that the anime added a million manga-buying fans, which means there are roughly 20 (give or take 10) times as many manga-buying fans of the series as there are anime-buying fans. Since the anime disks come out once a month and cost around 5000 yen a pop, whereas the manga volumes come out one every 4 and cost about 500 yen a pop, this means that the anime-buying fans are paying 40 (give or take 20) times as much. In this particular case, the purchasing power of the manga and anime buyers is within a factor of 2, but Attack on Titan is one highly exceptional example. Series don’t always produce equivalent gains in the marketability of anime and manga.
I’ve previously taken a look at manga sales for those manga which got an anime adaptation in 2011 and 2012. Using those data, I compared the *gains in sales* from the 37 manga I had hard numbers for against their initial sales levels, the sales of their anime disks, and the myanimelist rankings of the anime series. The Pearson correlation coefficient, a value between 1 and -1 indicating stronger correlations the further it is from 0, for each value is given below:
vs. Initial Sales: 0.10
vs. Anime Sales: 0.48
vs. MAL Ranking: -0.25 (negative, indicating a ranking closer to 1 corresponds to more sales)
vs. MAL Ranking, adjusted for influence of Anime Sales: -0.34
The anime market is complicated, and none of these correlations are absolute. But it’s suggestive that whatever a manga is selling beforehand has very little to do with its final sales, whereas Anime sales and mal ranking show correlations several times tighter. More interesting, these two indicators seem to work at cross purposes; accounting for the Anime correlation makes the mal one stronger. The mal correlation is very clear in graphical form: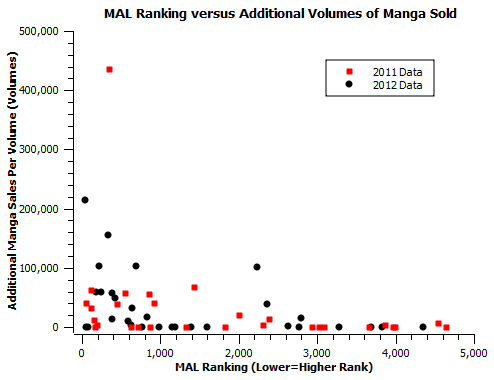
In short, the series that produce explosive sales increases are the ones that rank in the top 1000 or so on mal. The two exceptions to that, Toriko (red, rank ~1400) and Thermae Romae (black, ~2200), have exceptionally high TV Ratings and shared credit with a Live-Action Movie, respectively. So it’s fair to say that late night anime tend to please both Japanese and Western audiences. For this reason, I would argue that the differences in mindset between Japanese and Western fanbases, while not nonexistent, are overblown. It’s not about the culture so much as it is the amount of money specific groups in that culture are spending. This isn’t an ironclad principle, but it is a piece of information that should inform the discussion when talking about the practicality of depending on Western audiences to pick up a bit of slack for certain anime like Santa Company (via the Kickstarter that you can still fund) and Space Dandy (super-simulcasting with Ian Sinclair as the title character); you can potentially grab domestic fans in the similar ways, so shows that target those groups anyway should consider ways for people to pay for something costing less than a new triple-A game.* While 20 times the customers for 1/40 times the per-volume profit isn’t too juicy a market proposition, there might be a sweet spot on that demand curve.
Indeed, the more general question on the table here is whether or not something like the Little Witch Academia Kickstarter, where the majority of pledges came at pledge amounts of 50$ or less (admittedly for 40 minutes of anime), would be sustainable for a larger-scale tapping of large, less-monied fanbases (be they Japanese, Western, or both). And if so, what sort of anime might they be? OVA bundles for popular manga with no anime, perhaps? Those are more difficult ones, inside the scope of the metaphor but outside the scope of my current data.
*It’s also a useful counterpoint to those who approximate Japanese anime fans as having a single fundamental set of tastes, rather than a spectrum, and complain about shows being a certain genre because of that, but I’m pretty sure those people don’t read this blog. I seriously wonder how discussions about tastes of people with different nationalities would differ if we constantly got hard figures for what boxsets were selling in the U.S. Even with their heavily reduced prices, I expect we’d see a number of departures from many popular narratives when looking at U.S. fans who spend more than $10 a month on their anime hobby.

Pingback: Fun With Numbers: The (Relatively) Predictable Light Novel Adaptation Market | Animetics
Pingback: Fun With Numbers: The West-Side All Stars | Animetics