Ever since Inu x Boku SS first drew my attention to the subject in June of this year, I’ve been quite interested in the concept of anime in the context of its broader commercial impact. It’s not exactly counter-intuitive to point out that anime doesn’t get made in a vacuum where disk sales, important as they are, are the only thing that determine the success or failure of a project. There are many factors that play into that equation; licensing cash, character goods sales, TV ratings, etc.
But manga sales are particularly interesting for two reasons. First, we can track them fairly easily; animenewsnetwork keeps English-language versions of the weekly Oricon rankings of manga that date back to 2008, so there’s a lot of baseline data that we can compare with newer series. So when Blue Exorcist did Blue Exorcist things…

…it’s pretty obvious where the cause lies. Second, because the increase in sales per volume can potentially be really high (see above chart), it’s sometimes worth it for manga publishers to take a gamble and partially fund an anime adaptation. While such funding isn’t going to pay for most anime by itself, readers of this blog will be aware of the tangible influence of marginal increases in financial stability.
What follows is an analysis of how manga to get an anime adaptation in 2011 fared overall at the marketplace, with a look at when and why publishers chipping in for an adaptation ala Shonen Sunday in 2013 is a good business move in theory (while still hinging, as everything ultimately does, on competent execution).
Before I get started, one caveat for those trying to take information out of this article. This is an analysis on just the sales of manga and their relation to manga adaptations, and not of light novels and their adaptations. The two differ in a bunch of key ways, both in terms of what goes into an adaptation each and their respective core markets. Suffice to say that while every light novel but one (OniAi) to sell in the yearly top 25 in either 2011 or 2012 topped the 3000 per volume sales profit line, the same cannot be said for manga.
The bulk of the datapoints used in this article come from a pair of summary articles here and here reviewing the sales of manga that got anime adapatations in 2011. After some deliberation, I decided to restrict the sample I was analyzing to just anime that had their first season air in 2011, excluding those that only got second or third seasons, because doing so would unfairly over-represent successful series. What exactly happens with big successes like Natsume Yuujinchou and Kimi ni Todoke is interesting in its own right, the scope of this column is to determine exactly what the real odds of getting a plus out of funding an anime in the short term (t<1 year) are.
To actually get a measure of how much in terms of additional manga sales the anime produced, I took the difference of the first two volumes released at least 2 months after the anime aired last two volumes released before the anime aired, getting the net sales gained per volume. It’s important to consider the total gain in sales, rather than percentage of improvement, because a yen gained from a doubling of sales is worth exactly as much as a yen gained from a 1% increase. This still isn’t a perfect approximation of an adaptation’s promotional value because it doesn’t account for the fact that some series come out every 2 months and others every 6 months. TV ratings for those that aired on network (as opposed to satellite) TV are included as well. The results of these calculations are plotted on this doc, and charted in various ways below.
Note: In general, Blue Exorcist as a datapoint is excluded from the graph, because scaling to it makes the trends for more marginal gains far less visible. Here’s the brief summary of its stats: it kicked phenomenal amounts of ass across the board, breaking 10k in anime disks per volume sold, boosting the manga’s first-week sales from 40k to 400k in a matter of months, and putting up solid ~3-4% TV ratings in a 6pm/18:00 slot. It’s definitely the single most important show in this sample, because it represents the explosive upside that makes funding anime adapatations of manga a good move in spite of the minuses.
Putting aside the big “how much should we manga publishers invest in anime?” question (we’ll get to it later in this column), I’m interested in what might predict the big sales increases for adaptations of upcoming manga. If things we knew before a series aired could tell us a lot about how that series would eventually do, it would be a nice crutch to lean on in breaking down, say, Nisekoi this winter. There are two things recorded in my sample we do typically know about an adaptation before it airs; how popular the manga is and when the adaptation airs. Let’s see how both of those stack up against the eventual gains the series got:
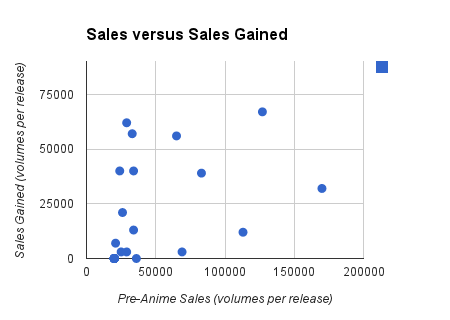
There’s not much of a strong correlation here. While those with moderately higher pre-anime sales do seem to fare slightly better, there’s not a very strong in this plot. The series with the highest sales level pre-anime produced fairly modest gains, whereas multiple series selling under 50,000 volumes saw their sales level jump by over 50,000.
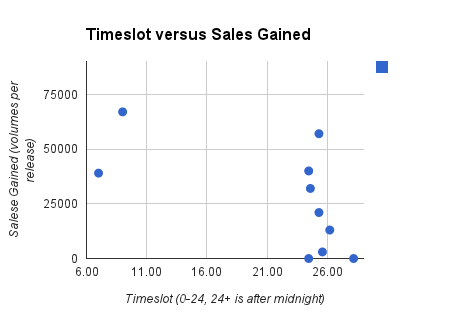
Toriko and Beelzebub, the two shows in morning slots (on the left), both produced measurable gains. They do seem to put up a better average than the after-midnight crowd, though in this case the sample is fairly small and I hesitate to say too too much. The after-midnight shows host a larger number of unimpressive performers, though Kimi to Boku did outdo Beelzebub’s totals. The more visible timeslots are producing better opportunities for the anime to reach the manga’s target audience.
Once you get down to just the late-nighters, though, visibility doesn’t seem to matter quite so much. The TV ratings for the same shows are plotted below:

I’d suspect the difference between ratings on the order of 1% and 2% aren’t particularly important; at that point, it’s less about reaching a large audience and more about reaching your target demographic. Also, it’s hard not to think that abundantly available illegal streams don’t play a role in making TV ratings data for late-night anime more or less meaningless. Alternatively, it might be reflective of a larger trend:
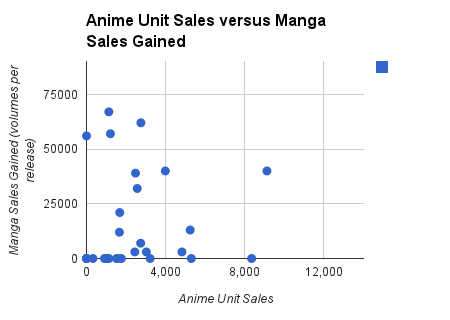 The general success or failure of late-night anime is not at all reflected in the enormously scattered levels of sales gained by the manga. These are basically uncorrelated. It’s a point in favor of the theory that anime and manga fanbases are very largely decoupled by, among other things, level of disposable income (it cost around 10 times as much to buy a volume of anime as it does to buy a volume of manga, and anime comes out twice as fast as the fastest manga). That would explain why more gross profit has been made on 4 manga-bundled OAD episodes of Yozakura Quartet than will be made on the entire 12-episode season of Hana no Uta.
Because I had some spare time and the data was there, I also decided to check and see how these sales gains compared with the myanimelist statistics (ranking and popularity of the anime adaptations):

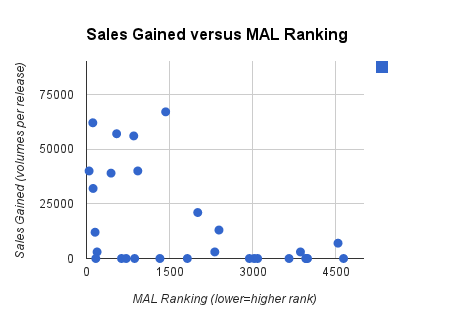
There seems to be a weak correlation with more MAL popularity, and a somewhat stronger correlation with MAL ranking. While it’s by no means absolute, it’s very clear that the one ranked 1500th or higher* were the ones that produced all the big gains in manga, and there’s almost no gains in the adaptations that ranked 2500th or lower. That’s actually extremely interesting. While I’d have to look into it some more to get the full picture, I’d suspect that there’s something to that. It’s quite plausible that a show that’s trying to sell something, like a good salesman, can’t just get people to notice its product; it needs to get people excited about it, especially relative to the rest of the field.
Back to the question that drove this research; what are the gains that manga publishers can expect to see from an anime adaptation, and thus how much should they chip in on such an adaptation? Well, since we’re talking marginal portions of anime budgets, it makes sense to put a cutoff at the lowball end of an episode budget; let’s say an anime adaptation has to generate more than 10 Million yen in gross profits per volume of manga to be considered worth investing in at a substantial level. There are 10 such series in my 30-series 2011 data, so one could expect to recoup that investment roughly 33% of the time. That, by itself, is not that great a number. But then there’s the question of explosive upside.
 If an anime can take an also-ran manga and make it a franchise, you’re getting back far more than what you chipped in. Though Blue Exorcist was the only series to produce a gain in first-week sales of over 100,000 volumes in 2011, data from the first half of 2012 (linked to in the first sentence of this article) reveals those two additional seasons contained 4 such shows (Inu x Boku SS, Thermae Romae, Space Brothers, and Kuroko’s Basketball) amidst 16 total adaptations. So the actual odds of an anime making a franchise could be substantially higher than 1/30. If we average the two time periods, we get a revised likelihood of (1+4)/(16+30)=5/46~11%.
So what deciding to contribute to manga production comes down to is a high-risk, high reward gamble. While companies may lose part or all of their investment about 65% of the time, they also run a respectable 30% chance of making it back and a 10% chance of having a mid-tier series making the leap more or less instantaneously to a franchise title. If you’re putting out 3 volumes of manga a year, the average net profit is something on the order of (0*.60+10000000*.30+50000000*.10)*3 -10,000,000 = 14 Million Yen. That’s a respectable chunk of change, largely thanks to the enormous potential upside. And that upside only goes up the longer you plan on having a manga run; ask the folks at Kodansha how happy they are to have their hands on Space Brothers and Attack on Titan right now.
That said, manga adaptations are actually a pretty outright risky deal for the people doing the adapting. The average per-volume sales of the anime adaptations in the 2011 data are pretty dismal; with Blue Exorcist, it was a paltry 2782 disks. If that were a season of anime, it would be the worst overall sales average since HD-DVD surrendered the format war, and adding in a marginal contribution from manga sales only moves the needle so far forward. That’s likely a reason why we see proportionately more adaptations of games, light novels, and varying degrees of original stories in the modern era. One of the reasons the OAD-bundle market continues to be super-interesting to me going forward is that it represents an avenue for manga publishers to continue to reap big gains from the 20-minute commercials that anime adaptations represent from a business perspective.
*While it’s not my favorite piece of work and was written some time ago, I’m still firmly behind the main point of this article; as much debate as it ignites, the functional difference between an anime in the top 10 and an anime in the top 100 or even 1000 is, functionally, jack diddly. To make an even more biased editorial comment, a debate about the best 10 anime is fundamentally misguided, because there are hundreds of greats out there and making a list that small is going to stifle either the ones with great personal appeal or the ones with great universal appeal. While they’re interesting and indicative when when binned by the hundreds, toplist rankings themselves are largely useless compared to a good, long, sweeping discussion in measuring the relative quality of various anime.
Errata: I forgot to include Level E (no notable gain) in this sample. It doesn’t drastically alter any of the results, but it does deserve to be noted.

Pingback: Fun With Numbers: Anime as Manga Advertisments in 2012 (and their respective myanimelist ranks) | Animetics
Pingback: Fun With Numbers: Guesstimating the Break Even Point of English Dubs | Animetics
Pingback: Fun With Numbers: Correlation Coefficients in Manga Sales Boosts and The Kickstarter Analogy | Animetics
Pingback: Fun With Numbers: Anime as Light Novel Adapatations in 2011 | Animetics
Pingback: Fun With Numbers: Yuruyuri and the Manga Iceberg | Animetics