Update 2 (July 15, 2014): New, more accurate data is here.
Update (Jul 1, 2014): This post doesn’t measure releases in 2-week totals, which turns out to be a huge deal in many, many cases. I’m currently working on an updated version of both this and the other 2011-2012 manga boost posts. Just be aware of that before citing the data from here regarding any one show.
Way, way back, I published an article looking at how anime adaptations produced in early 2012 affected the sales of their source manga. It was interesting data to take a look at, and it was interesting to see which anime really boosted the manga sales. Long story short, there are cases where a manga really jumps from mid-tier to franchise level (Space Brothers, Kuroko’s Basketball, Inu x Boku SS) soon after the anime airs, and cases where the anime doesn’t have much visible effect.
Also way back, I started pulling sales records for manga that had an anime adaptation air in 2011, to get a better idea of how the two media are interrelated. This post contains the second half of that data, specifically the data for which I have maximum constraints for series before they aired, and at least one solid instance of making the Oricon charts afterwards. These aren’t quite the tier of hits in the first part of the data, but they’re more marginal, which makes the charts pretty interesting by themselves.
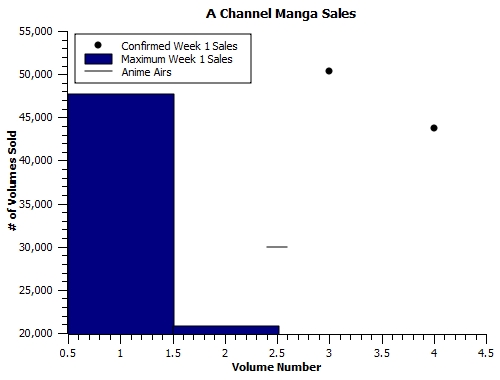
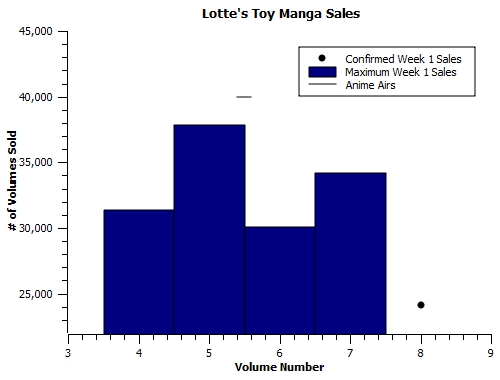
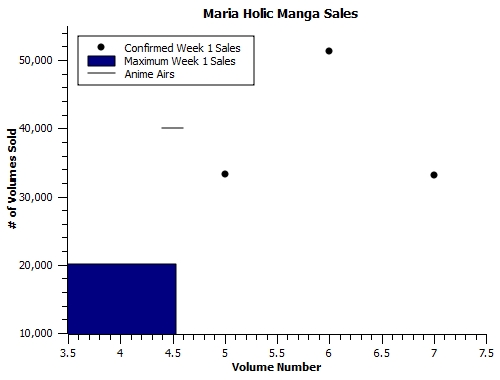
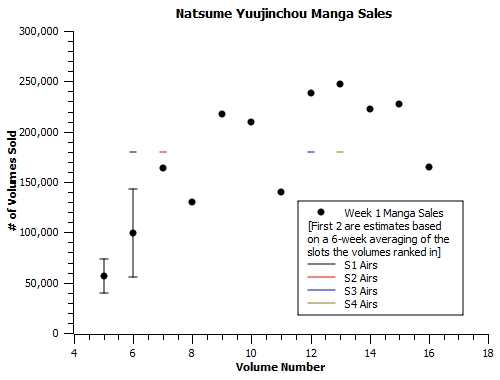
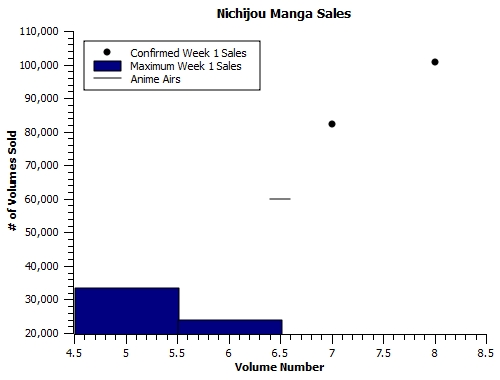
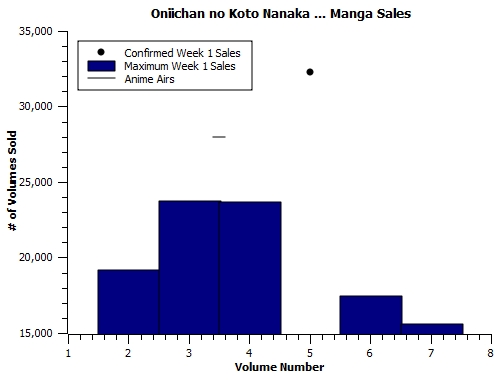
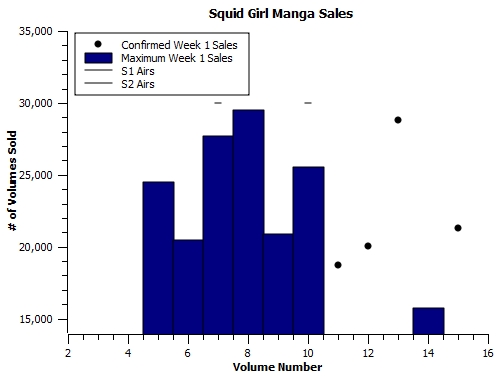
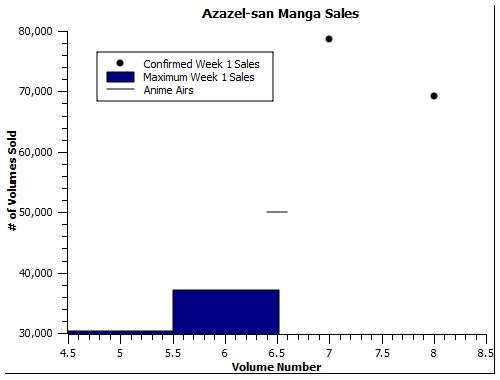
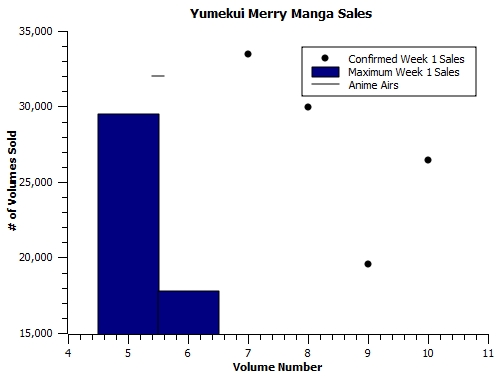
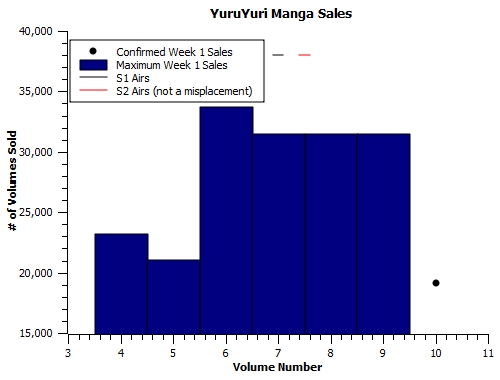
Below are graphs showing the progression of manga sales over time. Bars represent weeks when a new volume was released but did not chart, points represent a release week when the manga did chart. I considered the first week to be the first day when the volume was on sale for 2 or more days, to attempt to avoid cutting off bottom-heavy manga. All graphs are based on the numbers collected on this doc, taken from 2008-2013 Oricon Rankings via ANN.
A Channel
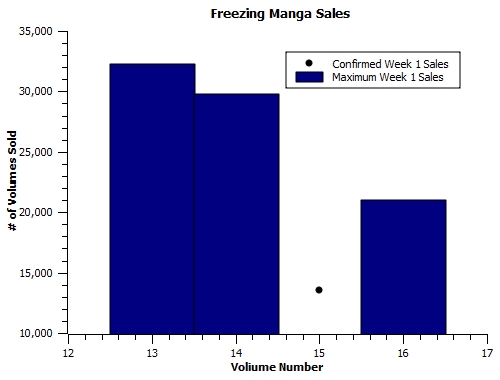
Freezing
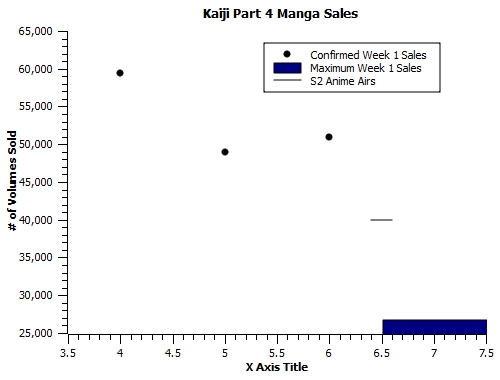
Kaiji: Hakairoku-hen
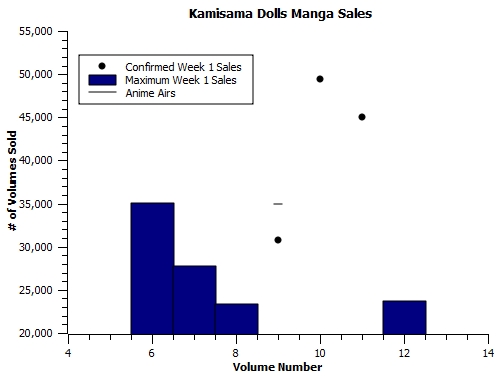
Kamisama Dolls
Lotte’s Toy
Maria Holic
Natsume Yuujinchou
Nichijou
Oniichan no Koto ga Zenzen Suki ja nain Dakara Ne
Squid Girl
Yondemasu-yo Azazel-san
Yumekui Merry
YuruYuri
As before, a couple of observations:
-Even leaving aside the question of causation, a manga charting after an anime airs does not mean it’s selling better after the anime. Freezing and Lotte’s Toy are probably the most outstanding examples, where the one volume that did chart put up a total that would have had it out of the running in most other weeks.
-Related to that, it’s worth noting that the Oricon charts for manga (or at least ANN’s tracking of them) have expanded from 10-30-50 over the years, making it easier for newer volumes to chart. I’m glad to have the additional information, and false positives generated that way are piss-easy to spot.
-Natsume Yuujinchou’s been around a long time, and though I’ve made some assumptions to guess at the level its first two volumes were at due to 2008 articles that only had top-ten placings, taking the mean and standard deviation over a six-week period as noted on its chart, there’s still more than a standard deviation of improvement visible after the anime aired. It’s a nice boost to go along with a show that’s had rock-solid sales through 4 seasons.
-While charting at all is still an impressive feat, doing so at a level below 30,000 volumes doesn’t mean much. In all likelihood, the only reason a show that charts that low hasn’t done so on its previous releases was because they came out in strong weeks (read: weeks with lots of Shueisha titles). As a rule of thumb, manga that get over 40,000 sales in a week after not charting previously *are* showing some improvement, though it’s not guaranteed to be caused by the anime.
-For a manga that picked up modest gains from 30,000 to 40,000, the additional gross profits are equivalent to 10000*500*3=15 million yen, or about +360 BD volumes in average sales for a 12-episode 6-disk series. That’s fairly respectable, especially considering that a lowballed anime budget for a series of the same length can be around 120 million yen. Bigger gains by otherwise unsuccessful Maria Holic may have been a factor in its second season.
-Kaiji’s woeful sales in later volumes of Kazuya-hen seemingly started after season 2 aired. This may be random fluctuation, or it may be some process I don’t understand. It wasn’t just for the one volume after, It apparently didn’t crack 20,000 for its latest release, which was only on the generous top-50 charts for a week.
-For as weak as Nichijou’s sales totals were, it still did a heck of a job boosting manga sales. The gross profit from those later volumes is the equivalent of about 1200 blu-ray disks.
I’m going to analyze this data, along with the first half, in the near future. This particular information is important to have, though, as you can’t just assume that a) series that sell on the 30,000 level behave the same as the ones that sell on the 300,000 level, or that b) shows that chart after the anime are proof that the anime improved sales. This still isn’t a complete sample, because some manga never charted at all. But it’s the best I’m liable to get without signing an NDA or actually knowing any of the people involved.
And believe me, at this point I’ve got a wealth of harvestable data at my disposal. Hopefully the purpose of this particular exercise (looking for a tracer of manga sales boosts from anime) will come to fruition sooner rather than later.

Pingback: Fun With Numbers: How Much Does Promoting Manga Help Anime? | Animetics
Pingback: Fun With Numbers: Anime as Light Novel Adapatations in 2011 | Animetics
Pingback: Fun With Numbers: Two Weeks Are Better Than One | Animetics
Pingback: Misinformation in the Anime Community Part 2: The Manabi Line | PavoKujaku