Update 2 (July 15, 2014): New, more accurate data is here.
Update (Jul 1, 2014): This post doesn’t measure releases in 2-week totals, which turns out to be a huge deal in many, many cases. I’m currently working on an updated version of both this and the 2011 data. Just be aware of that before citing the data from here regarding any one show.
By all rights, a 30-series sample like the one I had for 2011 was enough to get most of the relevant information regarding how anime boosted manga sales. However, during that analysis, I bumped into an incidental correlation, myanimelist ranking versus gain in manga sales, that was far too juicy to ignore. If that correlation is real, it points to a very tangible link between the Japanese mainstream community (who have enough disposable income for manga but not for anime) and the English-speaking online community (who generally pay a comparable pittance, if anything, for the anime they watch). But I couldn’t be sure from just the 2011 data, since that was the sample that gave rise to the theory. So I did what any good researcher would do, and pulled another year worth of data to see how things would match up. The results can be found on this spreadsheet, and are sorted in order of descending myanimelist rank below.
Manga Name (mal rank of anime adaptation)
DNC=Did not chart on the Oricon rankings at any time
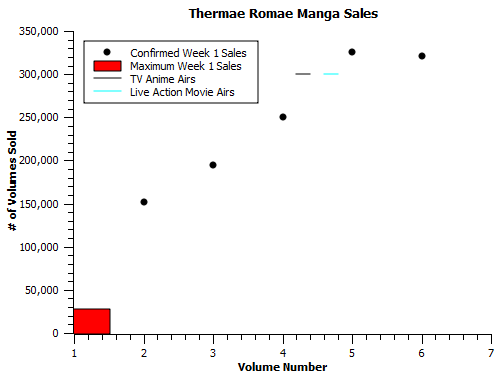
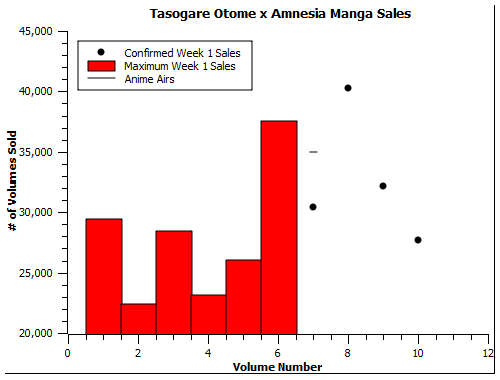
It’s important to note that a DNC does not immediately signify either crappy sales or no boost from the anime. Hypothetically, a series selling 5000 copies per volume before the anime could sell 15,000 copies per volume afterwards, and we wouldn’t know about it (though if it were 30,000 or higher, we almost certainly would in the modern Oricon standings). We can’t say whether these series got boosts or not, just that they didn’t get huge boosts. Incidentally, the situation with series that have later volumes chart is similar, in that we can’t say definitively whether they improved or not unless the improvement is above the maximum for previous volumes. Tasogare Otome x Amnesia below is a good example of a case where there’s some visible (and real, I think) gain which you could make a plausible case against due to the exact thresholds for previous volumes.
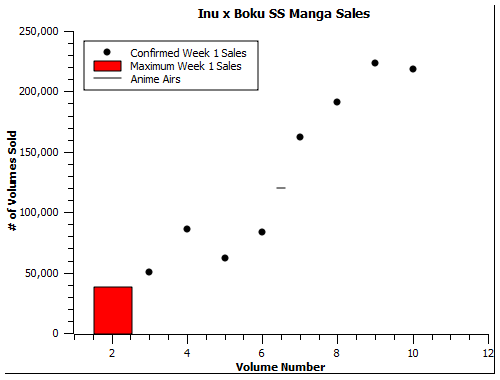
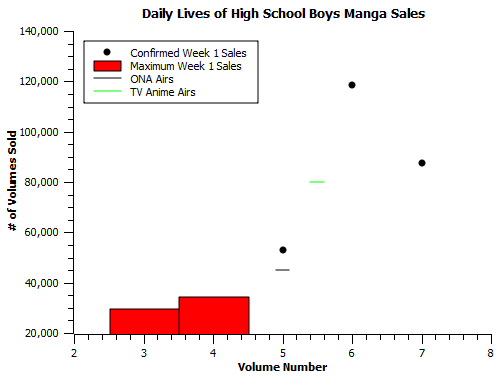
Another thing to note is that the gains the manga gets don’t manifest the instant the anime airs, but usually takes 2-3 months for people to catch up to and buy the current volumes. This was prevalent in the 2011 data, and is how I explain the several instances of anime airs->same sales for one volume->sudden, distinctive jump in the data below. When series did produce immediate gains (Blue Exorcist in 2011, Daily Lives of High School Boys below), they were only a fraction of the totals later volumes would eventually attain.
Teekyuu (4346) DNC
Upotte (3824) DNC
Recorder to Randsell (3689) DNC
Kill Me Baby (3274) DNC
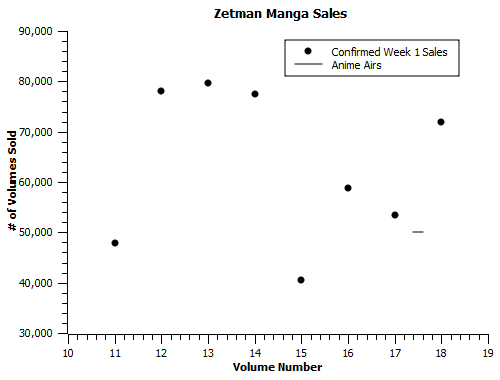
Zetman (2792)
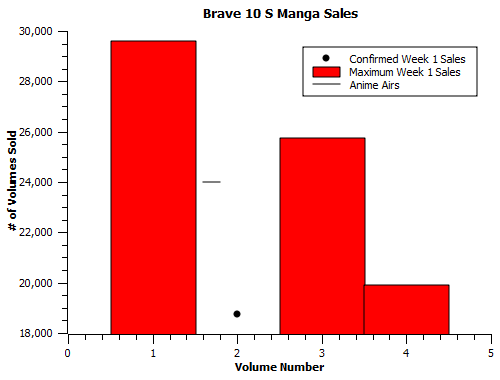
Brave 10 (2764)
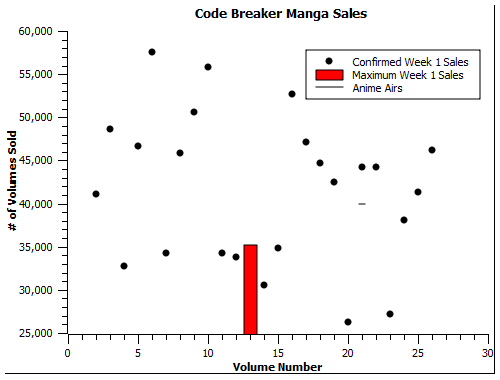
Code Breaker (2625)
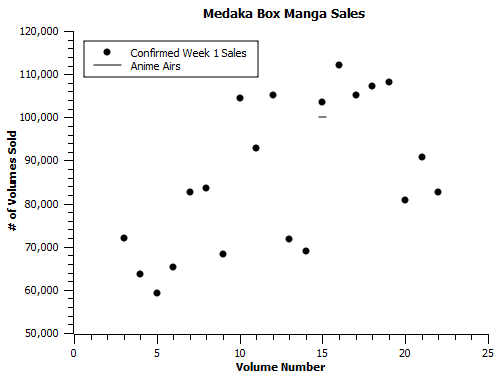
Medaka Box (2356)
Thermae Romae (2228)
Natsuyuki Rondevous (1590) DNC
Mysterious Girlfriend X (1389) DNC
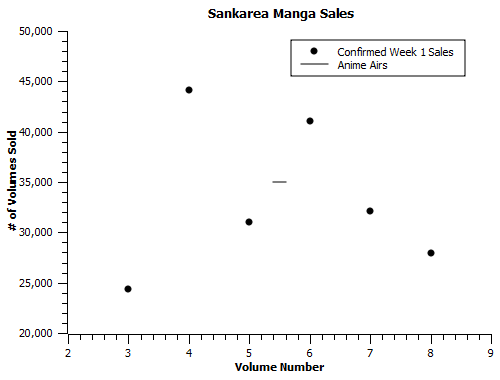
Sankarea (1183)
Utakoi (1144) DNC
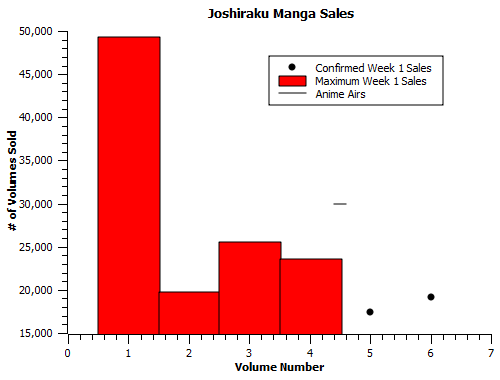
Joshiraku (987)
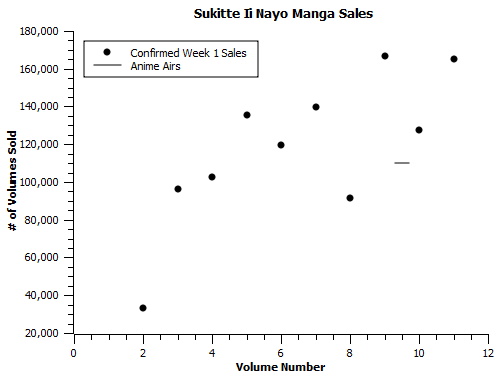
Sukitte Iinayo (831)
Acchi Kocchi (767) DNC
Inu x Boku SS (686)
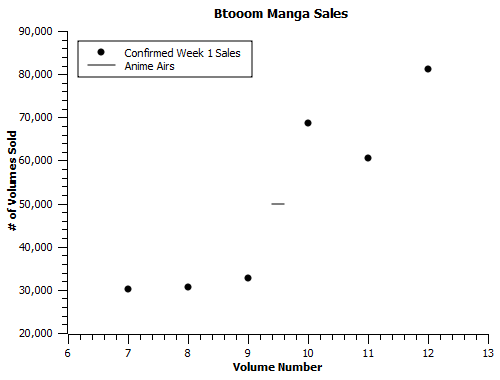
Btooom (645)
Tasogare Otome x Amnesia (630)
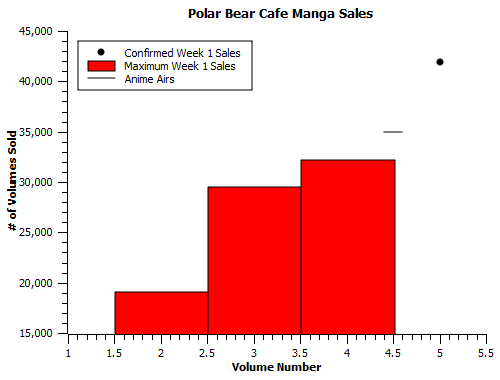
Polar Bear Cafe (586)
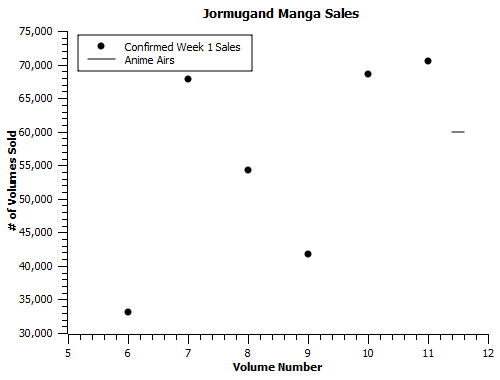
Jormungand (451) [Finished running before anime aired]
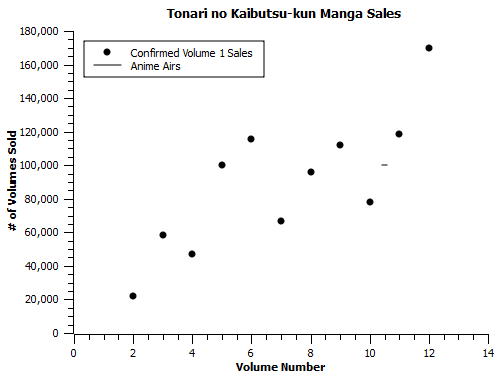
Tonari no Kaibutsu-kun (427)
Kamisama Hajimemashita (383)

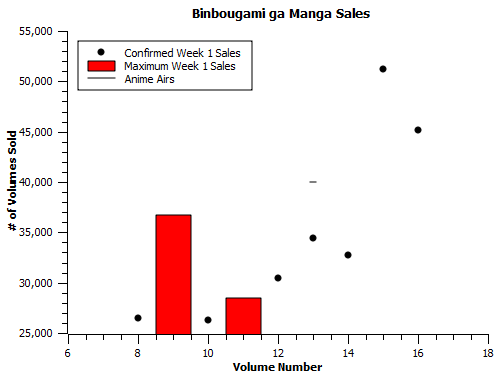
Bingougami ga (380)
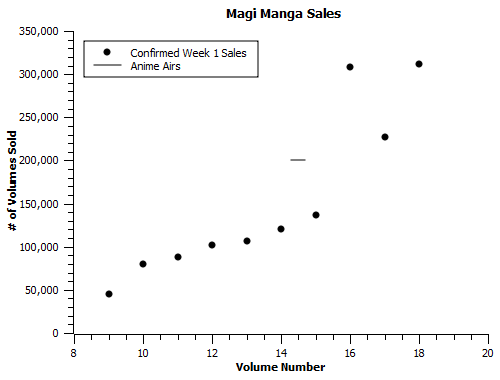
Magi (330)
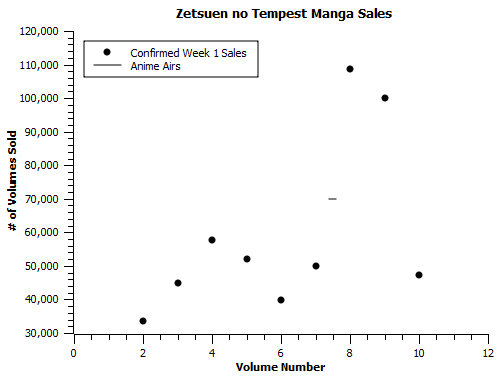
Zetsuen no Tempest (241)
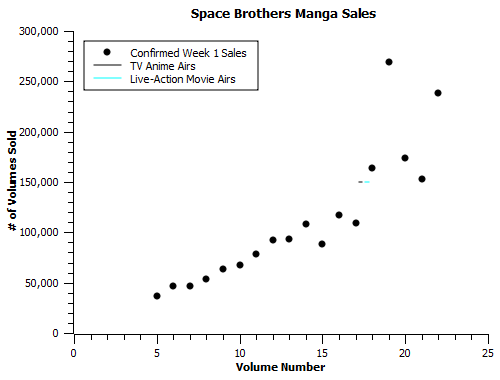
Space Brothers (222)
Daily Lives of High School Boys (180)
Sakamichi no Apollon (78) DNC
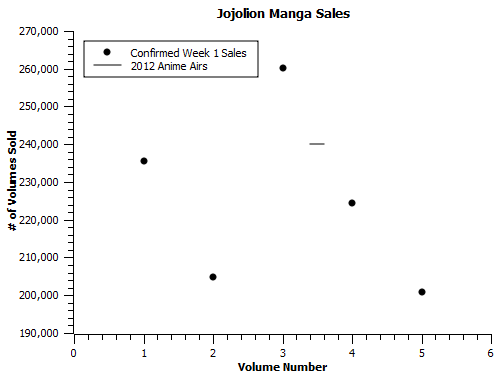
Jojo’s Bizarre Adventure (59)
Kuroko’s Basketball (41)
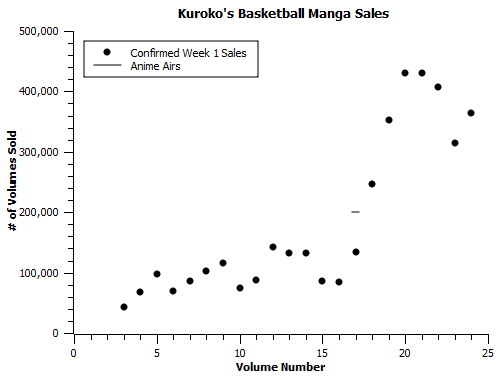
Aside from Thermae Romae, covered earlier, and Jojo’s Bizarre Adventure, a 100-volume series that people probably didn’t need a third anime adaptation to know about, there’s a pretty visible pattern of more significant and more frequent sales boosts as you climb up the myanimelist rank ladder. At the top, you’ve got manga like Magi and Space Brothers that caught fire as soon as they aired, and on the bottom you have the pitiful Medaka Box/Code Breaker/Zetman trio.*
This isn’t a 1-to-1 relation, though. There are plenty of cases like Btooom, ranked in the 600s, producing a bigger sales gain than Binbougami ga, ranked in the 300s. I handwaved that in the earlier Manga-Anime column by pointing out that the differences between 10 and 100 were a lot less than the differences between 100 and 1000 for any given toplist, and it should be noted in any future analysis that I’m considering the significance of mal ranks by tiers (eg. 1-500, 501-1000, etc.), rather than by exact score.
In general, this feels like an important bit of insight; much is made of the difference between Japanese and American fanbases, but what if most of that difference is really just the selection effects of a disposable income gap, rather than fundamental cultural differences between the two? I still have to crunch some numbers to get an exact feel for what’s happening with both these and the 2011 manga adaptations, but I have plenty of raw data at this point. Expect to see a column looking into the issue in more depth sometime soon.
*Of those, Code Breaker’s chart is by far the saddest because it *never* really improved over 26 volumes. I would pity Kodansha more over that one if they weren’t currently rolling in dough courtesy of Weekly Shonen Jump’s most prominent rejection. I mean, seriously, how crazy is it that WSJ would have had 19 of the year’s top 19 manga volumes (instead of the 9 they had) if not for the editing staff’s decision to give Hajime Isayama and AoT the rejection bin?

Pingback: First Reactions: Arpeggio of Blue Steel Episode 10 | Animetics
Pingback: Fun With Numbers: Correlation Coefficients in Manga Sales Boosts and The Kickstarter Analogy | Animetics
Pingback: Lists Are Fun to Make: Questions I’d Like to Attack in 2014 | Animetics
Pingback: Fun With Numbers: Anime as Light Novel Advertisments in 2012 | Animetics
Have you consider using Japanese fan ratings on NicoNico instead of MAL rankings?
A archive exists, but it seems to be a pain to harvest:
http://nikonikoranking.blog.fc2.com/
I wouldn’t use nico rankings *instead* of mal rankings; the two measure two presumably different things. It would, however, be interesting to gather the nico data and then compare the two. For one, I’m typically skeptical of the nico rankings’ ability to predict sales of manga or anime. I see them quoted a lot in the sense that quantity A for show X is bigger than quantity B for show Y, but I haven’t seen any juxtaposition with outcomes thus far to indicate that they’re a robust predictor in either field. More specifically, it’s also possible that nico has a more male audience that considerably handicaps the ratings of shows aimed at female audiences. Testing that in the first place would be thorny, but it’s a relevant point; Noragami is close to last on niconico and dominating the charts on mal, and Hamatora goes from dead last to 6th overall in the same transition. All the above are unsubstantiated beliefs, and thus things that deserve to be tested.
I’m just not sure if I’ll have the time to do so in the near future. I was originally collecting mal rankings as a curiosity, and because they were relatively easy to harvest (it probably added 2 hours to what was about a 20 hour task back when I was pulling data on all this junk), and having that pair of single numbers makes them easy to compare with sales data. Irrespective of the 99 problems that site’s community has, it’s got a huge userbase that offers an unrivaled sample of data available on Western tastes, albeit not necessarily those of paying customers. That is excluding amazon, which is simply a wicked tough nut to crack. Part of doing good analysis is finding problems that will yield a good amount of insight for a moderate amount of time invested, and the overhead on collecting and making sense of nico data seems to be fairly high for a payoff as likely as not to be significant.
Pingback: Fun With Numbers: (Admittedly Arbitrary) Qualifications for Significant Print Sales Boosts | Animetics
Pingback: Fun With Numbers: Two Weeks Are Better Than One | Animetics