Though there are plenty of sources out there from which one can learn about it, the inner workings of the US anime market are often characterized by what we don’t know. I track US anime releases on amazon because I’m curious about said market. That curiosity has several points of origin, but I chasing after one primary question; do fans buy the titles one would think they buy, to the extent one would think, from their presence on social media?
But tracking US amazon rankings is only useful insofar as these rankings have the potential to correspond to real sales data. And even that’s not particularly useful if the “real” data has the potential to be off by a factor of 100 due to unpredictable factors. One obvious potential contributor to the potential for underestimations are long tails, the combined contribution of totals from all weeks the release doesn’t make the threshold on a given set of charts. These are a very familiar foe when it comes to trying to compare sales figures, and are definitely worth addressing. There’s plenty of reason to believe long tails might be a factor in the US home video market – per-episode prices are much lower than they are in Japan, and thresholds are much higher.
I previously used a trial account to access the lifetime home-video sales totals of various anime movies in Nash Information Services’ OpusData database. Recently, I found out that the companion website to the service TheNumbers, stores years worth of back-data on its weekly charts, though its thresholds are, by design, severely limited compared to those measured on OpusData. Using those charts, it was a trivial task to go back to each movie’s release date and check how much of its lifetime total was accumulated while it was on the BD20/DVD30 toplists. Note that 2 of the 12 movies in the original sample never made said toplists and thus cannot be compared. Results are shown after the break.
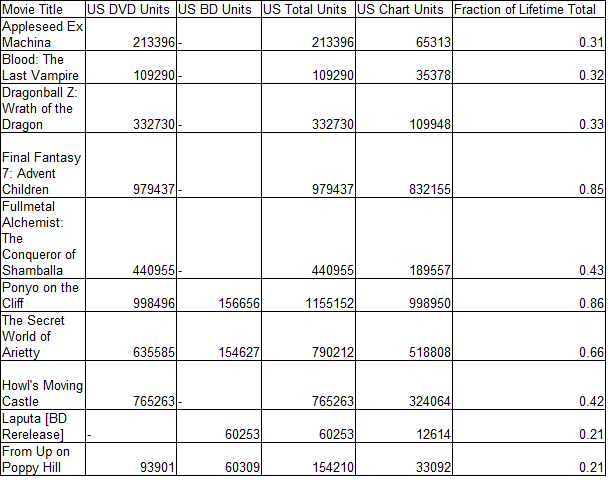
The average fraction of the final totals that toplists represent is approximately 0.46±0.24, meaning TheNumbers’ charts will, on average, represent a little less than half of the lifetime total, though they can range from a bit over 1/5th to just about 70%. Compared to the Oricon charts, which can regularly represent anywhere between 45 and 80 percent of the sales for a high-end release, US charts do seem to be a bit less front-loaded on average.
Just looking at the average, though, obscures a fairly obvious trend in the (admittedly small) sample: the 5 releases where charts most accurately represent the lifetime total are also the 5 best-selling releases, ones which typically charted for more weeks total and thus had long tails much more visible than their one-week wonder counterparts. For the five releases with lifetime totals under 400,000 copies (probably more representative of the American anime market as a whole), the average was about 0.28±0.04, a much smaller and less variant 30%. This seemingly represents a market a good bit less apparently front-loaded than Japan’s.* That sort of chart coverage, while less than could be hoped for, is not inherently bad for analysis so long as its roughly consistent between releases of similar scale (as it seems to be here).
There also is some reason to suspect the long-tail effect is a bit less prevalent now than it was in the mid-aughts; DBZ: Wrath of the Dragon came out in a September 2006 week with thresholds over 45,000 copies, while DBZ: Battle of Gods came out in a October 2014 week with thresholds a bit over 17,000.** Lower thresholds could mean less room for bigger tails to hide, among other things. I don’t know how generalizable this figure is to the modern market, but it’s good to at least have a baseline.
*This is not a statement as to which market is more robust. 4 anime franchises have charted in the past 8 months (One Piece, Appleseed, Attack on Titan, and Dragon Ball), 3 with per-volume averages of under 12,000 copies sold. 6 series from the Spring and Summer 2014 anime season put up better averages at much higher prices. Too, long tails are a potential factor-of-two effect, but price differences are a very definite factor-of-five one.
**I would also comment that Battle of Gods saw a much steeper dropoff from week 1->2 than Wrath of the Dragon did (86k->29k vs 50k->59k). Hardly worth drawing conclusions from, but it’s at least possible that preorders are frontloading US releases more than they have been in the past.

Pingback: Fun With Numbers: May 2015 US Amazon Data (Initial Numbers) | Animetics