Edit: Link to source document fixed.
Like those of any other free-access site, or any one set of numbers, statistics from myanimelist should be utilized with caution. But that doesn’t mean they shouldn’t or can’t be used. In this article, I’m looking the current rank and popularity of 38 shows from the Fall 2013 on myanimelist to determine how they stack up against other methods of doing the same. As before, note that any accuracy below the best null hypothesis of .66 is fairly insignificant.
By the by, the myanimelist stats used in this piece were taken in late April, 2014. Odds are they’ve changed a bit since the outset of the season, though shifts within the season tend not to be particularly cataclysmic. Most can probably be viewed as in a similar boat to December Torne/eps 9-12 Nico ranks, in that they’re made when the audience has more information about the show (i.e. has seen more episodes). I used both rank/score and popularity/total number of users to order the shows, and then checked how many v1 sales using the top 5/10/15 shows on those lists correctly pegs as over or under 4000 disks. Data can be found on this doc, and the results are below (indicators greater than the null hypothesis in green):
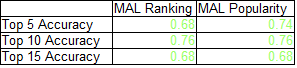 Turns out, both indicators do about the same, both beating out the null hypothesis for all 3 list sizes. Out of the metrics I’ve examined so far, that’s the best overall performance. Of course, keep in mind that this is a fairly small sample, and there are other ways (notably source material sales) that these indicators may be telling. It’s still fairly early in the project to say much, beyond the fact that mal stats are at least a little more indicative than random chance.

LOL It took me a while to figure out how the Top x accuracy vs. MAL ranking and popularity is calculated.
Anyways, I have a question.
You said that this data is collected in late April (ie. when Winter 2014 anime finished airing). This is a post using late April’s MAL data to predict volume 1 sales. When is volume 1 sales figure released (I myself don’t know), before, around the same time, or after late April? If volume 1 sales data is released after or around the same time as MAL data collection, what’s the point in “prediction”?
Prediction might be the wrong word, since as you mentioned it is data from after v1s went on sale. All of these predictions posts are really checks of correspondence; i.e. how well does stat x correspond to disk sales in particular. I’m interested in this stuff because nico numbers are cited really frequently and I’m somewhat skeptical of their accuracy, so I wanted to do some broad-scale tests of early-season predictors, and since mal data is available early on, I tossed it in there.
From what I’ve observed, the ranking of a series soon after it ends generally mirrors its ranking several months later, and how a series is ranked relative to its in-season peers after 2-3 weeks is generally a first-order predictor of their final order. It doesn’t always show where a series will rank among shows of other seasons, but the order between series makes significant changes fairly infrequently; Space Dandy/Hamatora and chuu2koi/Noragami were the two popularity swaps I recall happening over winter, and I was paying attention then.
TL;DR, since mal stats tend to place shows in relatively static orders early on, the April data can be used as a rough approximation of how they were doing back in the first few weeks (back before stalker predictions make the rest of the stuff moot). In the long term, I have data stored for this season and do hope to see how it evolves to check that more thoroughly.
Thanks for the explanation. Indeed as you said MAL ranking tends to be static during the period in which the show first-aires and just finished. Also as you said if a popular show have “really bad ending”, it would drop in score significantly.
You said in the conclusion that MAL ranking or popularity has the best “correspondence” with BD sales over 4000 so far. However, it is still not that much better than educated random guess, which leaves me wonder if any online ranking/popularity stats is suitable for “predicting” BD sales. I would venture a guess that other variables like “the popularity of source material” or “how much ecchiness are in the show” would have more relevance…
Source material popularity doesn’t seem to have much relevance for things that aren’t light novels; I’ve looked at it for both manga and video games and seen a crapton of scatter. Even for light novels, where the correlation has been fairly robust, we just saw an adaptation of one of the highest pre-show popularity levels (Mekakucity/Kagerou) bomb its way to a probable sub-5k average over the past couple of weeks. I think by far and away the most important thing for disk sales is how the core product is received.
Which is of course wicked complicated. As far as that goes, some online rankings do reflect a large base of fans, and many eventually BD buyers are presumably drawn from that fanbase. There are always amazon stalker rankings, which (at least by December) are historically very good at calling BD sales, being that they’re based on a very prominent online retailer.
Also, keep in mind that this Fall and Winter were some of the worst-selling BD-era seasons and thus particularly kind to the random guess. I’m working on Summer data for all of the indicators previously done for Fall, and that may or may not show a different picture (too early to say). It may all end up being worthless data, but I’ll have to do the analysis to find that out.
Side note: releases for volume 1s vary, but the majority of them start coming out in the last month of the season/first month of next season (i.e. December/January for Fall).
You’ve neglected a very useful data set there, being the data from the Fantasy Anime League threads. Obviously, this is watching+completed figures rather than total listed, but that’s probably a better figure to use anyway.
The other flaw is that there are series missing – Kill la Kill and Kyoukai no Kanata, as well as all the shorts.
Looking at the average rankings of the 11 remaining series with 4k+ sales for volume 1 on week 4 and week 14, you get an average of 14.2 for week 4, which improves to 13.5 by week 14. With 32 valid series (diamond no ace and phi brain 3 excluded of course due to not having any sales figures at present) a perfect correlation here would be 6, and a correlation of zero would give 16.5.
Looking at the actual rankings of sales (with all ‘no data’ treated as joint last) and taking the SRCC gives a rho value for week 4 is slightly under 0.16. For week 14 it is about 0.23. With 32 data points this gives a confidence level of barely over 60% for week 4, and even week 14’s data has a confidence level of marginally under 80%. Hardly convincing.
I’m not sure this is posted in responce to the right thing; KLK and Kyoukai no Kanata are pretty clearly included in the doc (rows 14 and 16 on the master list). The nico data post used them as well.
FAL for fall 2014 doesn’t include KLK and KnK because they were blacklisted as it was assumed they would be too popular. The specific threads containing the data I was using were this one http://myanimelist.net/forum/?topicid=681995 (week 4) and this one http://myanimelist.net/forum/?topicid=721923 (week 14), but there is data for watching figures at approximately 7pm GMT on Sunday from all 14 weeks from 6th October (week 1) to 5th January (week 14). The contest is run every other season and so makes it a very useful way of looking at watching figures as the series was airing.
Thanks for the links. It should be really useful in seeing how much places adjusted over time.
That said, I get that competitive balance would make the admins want to cut KnK/KLK out of it, but excluding them when looking at the efficacy of the mal data is taking away one obvious hit that you’d have to take away from the rest of the data samples to fairly compare (KLK) and one that wasn’t even a gimmie in all rankings; Kyoukai no Kanata wasn’t even top 15 in the nico rank % data for eps 1-4 or 9-12, and while it might have underperformed some expectations, it still put up a 6k+ v1 and a 4.5k average with 4/7 volumes out. If you add those two in, the average placing of the 4k+ v1s goes to ((14.2+2)*11+1+2)/13~13.9 for w4, ((13.5+2)*11+1+2)/13=13.3 for w14, where 17.5 is the no-correlation rank average and 7 is the perfect-catch average rank.
That’s far from perfect, but the same could be said of pretty much anything else I’ve looked at thus far. Oft-cited nico percentages included; out of the 26 series with available data, their eps 9-12 average % ranking for 4k+ v1s is (25+20+19+18+6+5+4+3+2)/9=11.3, where a perfect catch achieves 5 and random chance gets 13.5.
If a preseason indicator existed that was as good as stalker was, I’m pretty sure we’d all be using it regularly. I acknowledge that most of these indicators are flawed in one way or another, but that is part of the point – the 2 main goals I have here are to separate the totally useless from the slightly better than random chance and to see if any indicators tie strongly into source material bumps.
To be specific, I’m not sure which stat it is you’re breaking down here; is it the mal rank/popularity I’m using in this post, the fantasy anime data you have access to, or something else?
Also, I get the Spearman coeff in the 4th paragraph if this is FAL pop counts, but what the 14.2/13.5/6/16.5 in the 3rd paragraph is referring to is unclear. I’m sure it’s something, but what it is is not obvious to me, and it’d be really helpful if you could clarify.
The 14.2 and 13.5 are simply the average watch rank (from the FAL stats) as of weeks 4 and 14 respectively of the series that sold over 4000 copies for volume 1. 16.5 is the average rank of all series as there are 32 on the list. A figure of 6 would mean that nothing with sales of 4000.
The weeks I used were chosen because week 4 is usually about when the airing date of the first episode stops being significant, and week 14 is the last week of FAL and as such the last week of the data.
The sentence that ends partway through should be ‘nothing with sales of under 4000 had a higher watching figure than anything with sales of more than 4000’
I don’t know what happened with that – I did type it out but it deleted it. Perhaps the comments section doesn’t like less than/greater than signs.
Pingback: Fun With Numbers: Myanimelist Stats’ Correspondence with the Summer 2013 Disk Over/Unders | Animetics
Pingback: Fun With Numbers: Short-Term Versus Long-Term MAL Popularity | Animetics
Pingback: Fun With Numbers: Short-Term Versus Long-Term MAL Rankings | Animetics