A big part of my goal is to take a look at existing numbers and see what can be gleaned from them, but that doesn’t mean I can’t take a stab at collecting new metrics. This post is just a summary of one rarely-used metric I’m curious in gauging the efficacy of, normalized google traffic, for anime aired in the Fall 2013 season.
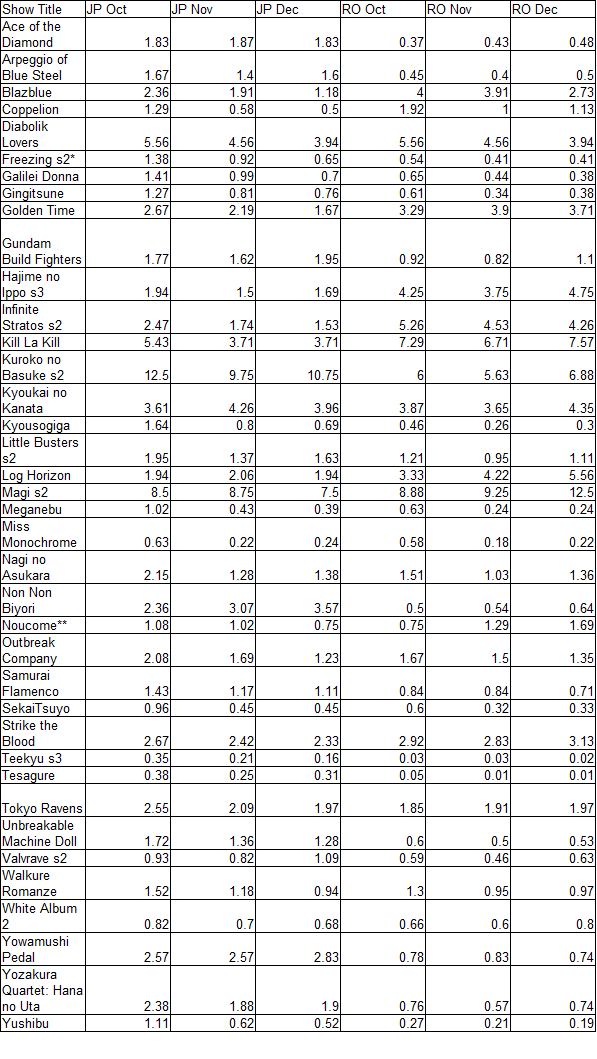
Why check google traffic? It’s not complicated; most people with access to anime have access to the internet. And most people with access to the internet end up using search engines a lot. So you can (theoretically) get a good first-order approximation of how much relative interest an anime has generated by checking its search traffic volume against some other predetermined total (the volume of the term “Fall 2013 Anime” for the month of October is used here). By using volume for both the original Japanese and Romanized titles, it’s possible to parse the traffic in Japan versus the rest of the world. Show data is found on this doc, and listed after the break for the 38 Fall 2013 shows whose v1 data I’ve been using in predictive tests.
Note: I used general franchise names, rather than specific show titles in my searches (i.e. “Yozakura Quartet” and “夜桜四重奏” as opposed to “Yozakura Quartet: Hana no Uta” and “夜桜四重奏 ~ハナノウタ~”). Also note that Diabolik Lovers’ Japanese and Romanized titles are the same. Each and every query used on google trends to get the data can be found here.
*RO term used “Freezing Anime”.
**RO term used “Noucome” instead of the full title.

Pingback: Fun With Numbers: Google Traffic Predicting the Fall 2013 Disk Over/Unders | Animetics
Pingback: Fun With Numbers: Normalized Google Traffic for Summer 2013 Anime | Animetics
Interesting, Tokyo Ravens had one of the higher (comparatively speaking) Google hits, and yet it it was still a turkey (pun intended) in sales. Also, Tesagure being pretty obscure, and yet selling very well for a short. Even more interestingly, Tokyo Ravens seemed to have more interest than Little Busters!, but the later still was among the top 5 sellers.
I haven’t crunched everything yet, but I think it’ll turn out that google is more indicative of the interests of general audiences in Japan (as suggested by TR/StB’s big numbers and above-average LN boosts). Best-case for me is that the data will generally show google being more indicative of visible source/low-cost boosts with one or more others being indicative of disk/high-cost sales – combine the two and you’ve got a really effective statline that’s available fairly early on.