It’s fairly common for manga or light novels getting an anime adaptation to receive some sort of boost in sales after the anime airs. However, both the presence or size of those bumps varies widely. These bumps represent an interesting opportunity for study, since they represent (potentially) an alternative indicator of both the financial impact of anime, as well as a look at the broader-scale demand curve for franchise-related goods. Not everybody can or will easily pay 30,000 yen for a full special-feature-laden set of disks, but such casual fans could still have a big impact on a series if the manga is within their price range.
The real fascinating part of this, though, is that casual fans need not support at all. While one almost certainly has to watch a show to be willing to buy the disks or even the manga, the reverse need not apply. The fact that the relation between disk averages and print boosts is so fragmentary implies a potentially similar disconnect between print bumps and total interest generated by a show.
In theory, sales should be better represented by casual indicators of popularity as costs get lower. In practice, the statistics are pretty garbled, though they do offer a hint as to which sorts of series may end up with bumps at the end of the day. To attempt to better understand the junk described above, I broke down 4 categories potentially indicating no-cost and low-cost popularity, and compared their ratings with the print-bump successes of series which got anime adaptations in Summer and Fall of 2013. Note that while I originally used Torne rankings in the earlier analyses, I discarded the data because of how incomplete they were.
For the purposes of this article, a “significant boost” is one where a series experiences a 20% jump in sales or charts for the first time after the anime. All figures are for a volume’s first 2 weeks of sales, calculated with the average of the 2 most immediate before and after volumes, if 2 volumes of data are available in each case. Be aware that this is not a comprehensive measure of which series got boosts, just one intended to at least catch the biggest ones. 1/3 of all series got such a visible bump, meaning the null-hypothesis accuracy rate these indicators need to beat is 66.6%~67%.
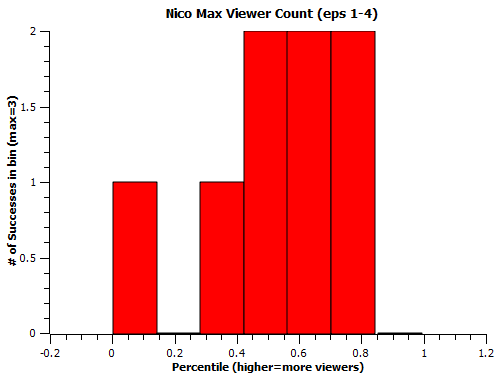
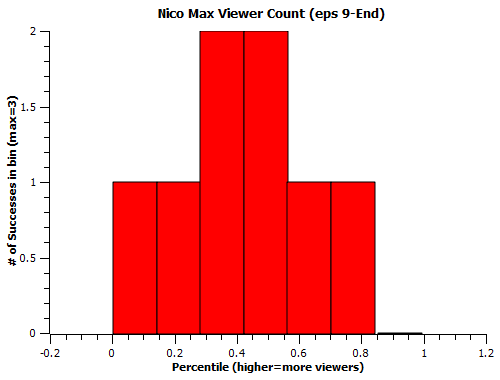
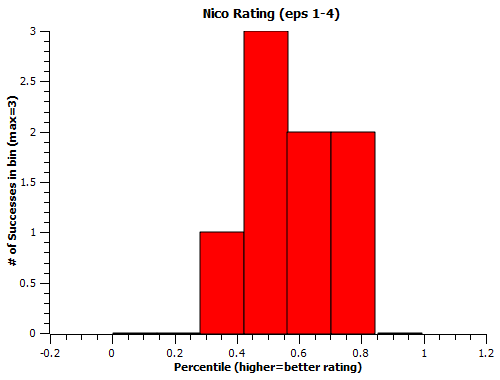
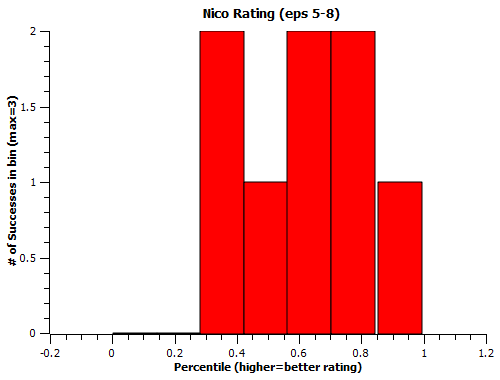
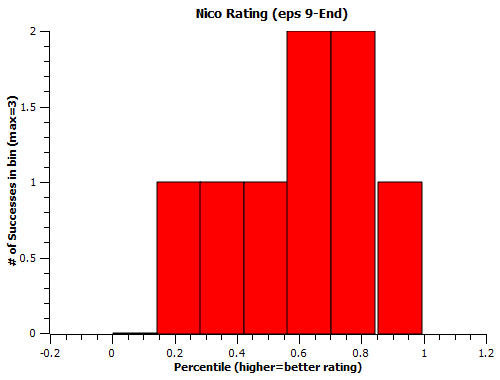
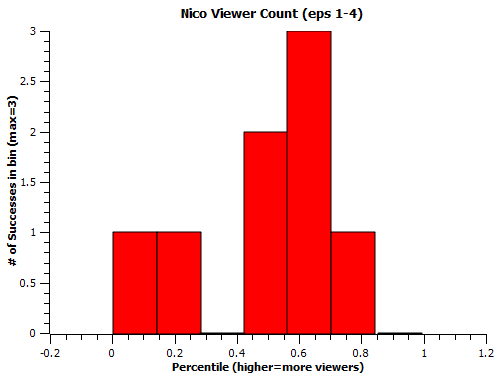
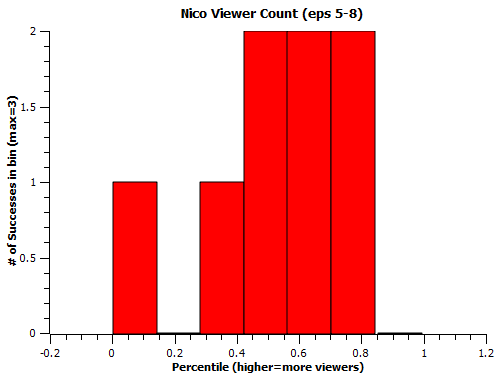
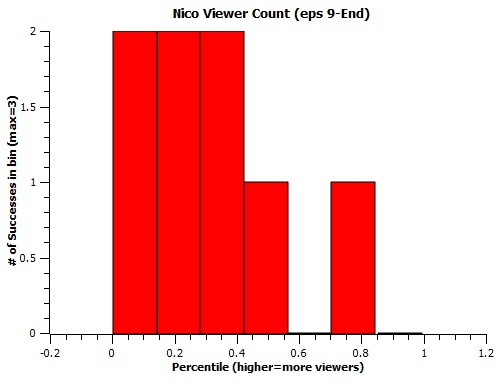
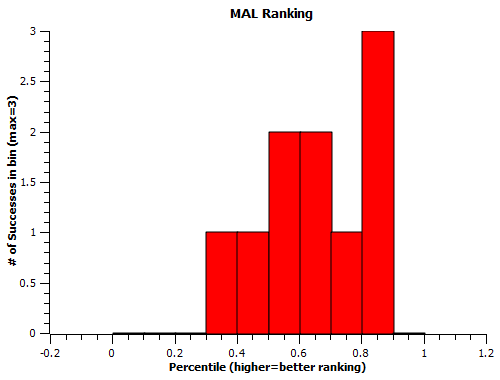
In addition to the previous top 5/10/15 tests used for v1 disk sales, I’ve also included histograms of how successful series were scattered across the indicator. Ideally, they would all be 60th percentile or better, but reality isn’t quite that nice.
1. Nico Stream Statistics (spreadsheet)
[To avoid confusion, Max Viewer Count=Viewer Count*% of people who rated an episode the max.]

Test Summary:
 These indicators are very much mediocre until you get to the endgame, when ratings start to look somewhat useful and viewer count becomes a downright terrible indicator. Anything averaging 85% or better that last month (corresponding to the top 10) had a good showing via either disks* or a print bump. My theory is that, by the time a show’s been airing for months, a more casual set of fans might fall behind a show and don’t watch the moment an episode is available, but those that do are representative of the positive opinions of a larger crowd. This result isn’t super-strong, but it seems plausible and is sure as hell getting tested further.
2. Myanimelist Statistics (spreadsheet)

Test Summary:
 Popularity doesn’t seem to matter much, but ranking beats out the null hypothesis by a bit for the top 15 case, and you can tweak the indicator a bit more by expanding that to include every show that finished ranked 1300th or better; 9 of the 16 shows in that group got significant bumps, only one did outside of it (Gingitsune, ranked ~2000th), and 4 of the 7 shows that indicator misses are series which never charted (meaning they may still have seen a moderate boost). I expect some of that to hold up when expanding to other seasons; Hataraku Maou-sama, OreGaIru, and Attack on Titan are the three highest ranked non-sequels from Spring of 2013, and all three saw big gains in the aftermath.
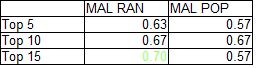
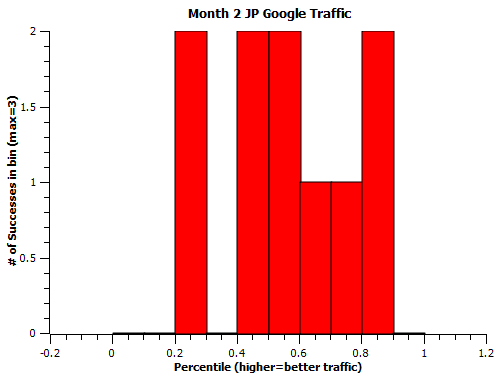
3. Normalized Google Traffic (spreadsheet)


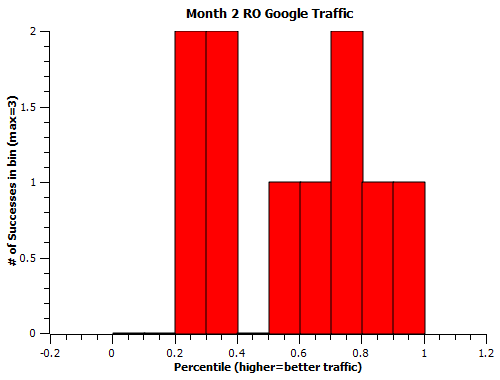

Test Summary:
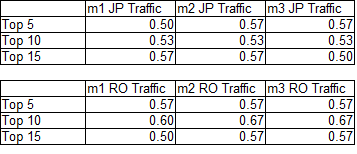 This indicator did alright in the disk market, but, rather surprisingly, there’s not a whole lot happening here in print. Things are just scattered all over the place. It’s possible the majority of increased search traffic is just people looking for streams of a series, with little to no intent to buy.
4. OP/ED CD Single Sales (spreadsheet)
Tacked this on partially as a reader request, and partially because CD singles only cost about 2000 yen, a price much closer to that of a print volume. Analysis of disk sales will follow. CD single data used is first-week only, taken from music charts available on myanimelist.

Test Summary:
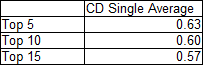
CD singles do not seem to have a particularly strong relation to the sales of lower cost goods, and they don’t seem to correlate especially well with disk averages among this small 30-show sample; Golden Time and Noucome, shows with sub-1k averages, were both in the top 4, and Love Lab and Yowamushi Pedal were very near the bottom. There may still be a general trend there, but it’s not a very strong one.
—
It’s really tricky to say that any of these indicators are an ironclad predictor of success, and the difficulty of doing so is perhaps the biggest lesson I’ve taken away from this whole exercise. Nonetheless, there is stuff here to study – if the online ratings/casual markets relations found in both nico and mal stats do hold up in Spring and Winter of 2013, that is an important and easy to access piece of information that can be used to break down future series’ chances of getting a print bump.**
*Granted, ratings being good for disk sales was something that showed up sporadically in those tests.
**Not to mention one could more confidently talk about both as indicative of a more widely-held public opinion.

Thanks. By the way, this website can prove useful: http://www20.atwiki.jp/keroro00innovator Gives more complete data. maybe you could do one for the whole of 2013?
Pingback: Fun With Numbers: CD Singles’ Loose Disk Average Relation | Animetics