The complexity of an iconic bit of animation, and thoughts on video analysis
In anime sales discussions, there is the oft-asked question of “why did series X sell well/poorly?”. Frankly, nobody has a great answer to it, and probably never will. There’s hundreds of factors, large and small, that go into how anime ultimately succeed (and fail), and the only people who can answer that question in a sentence are the uninformed and those projecting their own opinions and biases onto the masses. But this question does keep getting asked, because it is a fairly important question to the medium. And while answering it may never be a 100% realistic goal, that doesn’t mean attacking it doesn’t have meaning.
One of my ongoing goals has been to develop new methods of looking at anime. As someone with relatively little technical knowledge and minimal translational skill, I’ve generally relied on various different statistical indicators to try and suss some meaning out of particular series and scenes. For the most part, these analyses have been restricted to using easily-analyzed, readily available data, particularly sales and aggregate rankings. But analyzing anime that way comes with a lot of obvious limitations. In baseball terms, it’s akin to trying to analyze a baseball team when all you have access to is the final scores from their games – you might be able to peg the team as “winning”/”high-scoring”/etc, but you’d have no idea who scored those runs, or whether a team conceding double-digit scores to the opposition had bad starting pitchers or just crappy relievers. I’ve been trying to move beyond that limit and find a meaningful way of putting stats on very specific parts of episodes, rather than whole series. In particular, I built an algorithm a while back that can take the a character design image for a given anime and spit out a value that indicates, very approximately, how complex the image was (and thus how difficult it might be to use in animation).
But image analysis is complicated, and while I was able to get a fun article out of that region counter script, progress was limited.* What I really wanted to do was generalize that to something that could analyze clips or full episodes of anime for the same property (i.e. degree of difficulty in illustration). Part of that process, getting images from videos is easy (all you need is a functional build of FFMPEG). But the actual image analysis is a) time-consuming,** and b) stymied by the fact that backgrounds are typically way more complex line-wise than the animated foreground they accentuate. Frankly, I’m still kinda stuck on both of these. But I was recently watching the one and only Gaogaigar: King of Braves, and I realized something about the series’ trademark final fusion scene. Neat thing about it – for the meatiest part of the scene, every part of the screen, even the background, is animated! So I don’t have to worry about static backgrounds mucking things up, and can take a look at it to test what my current code can do.
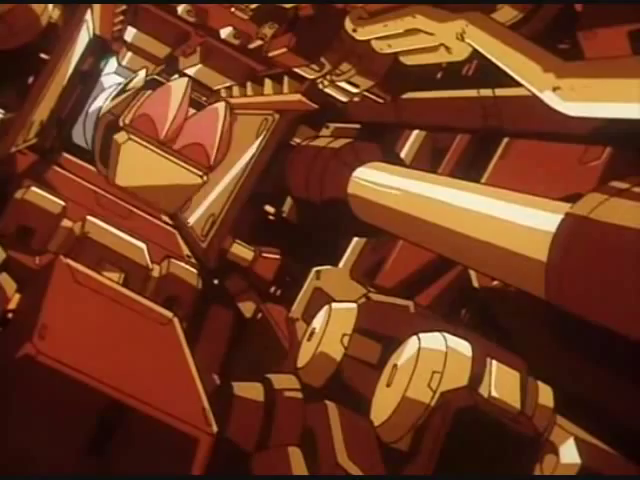
The method I used to analyze the video was fairly straightforward – the code took a screencap of the youtube clip above every second, 1-sigma smoothed each image to account for pixel-to-pixel noise, and then counted the number of unique regions in the smoothed image. The final fusion, packed with small particles and detailed-line mecha shots, is a pretty-looking 1-minute easy-mode testing ground. The images come out fairly intact and easy to dissect. For example, this picture from the 29-second mark:
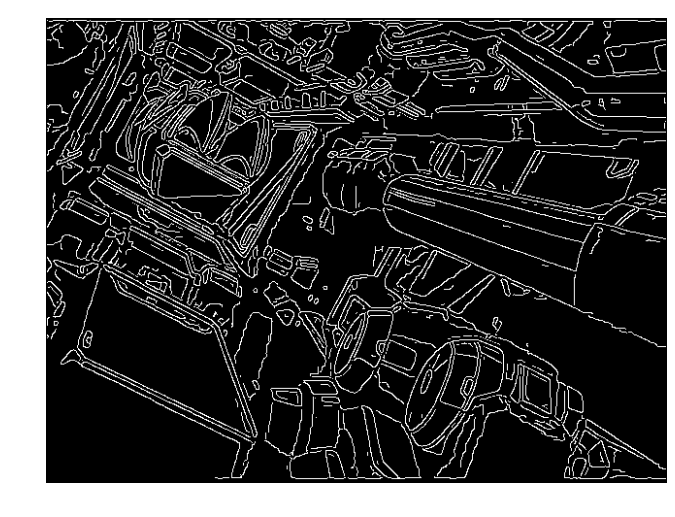
Gets broken down to this (with 854 unique regions):
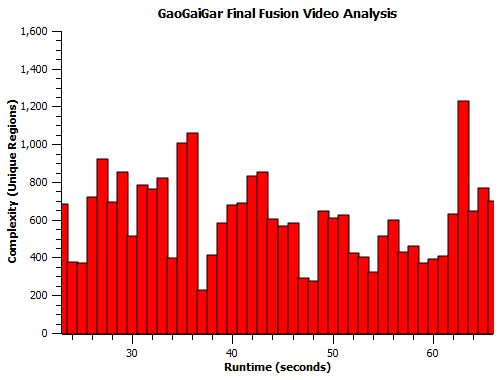
Over the length of the clip, region count varied significantly as cuts flashed by onscreen. Here’s the region count for each second of runtime:
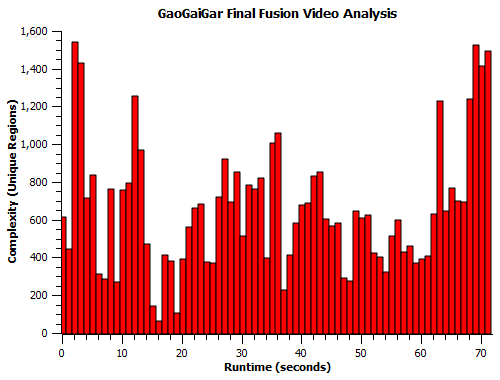
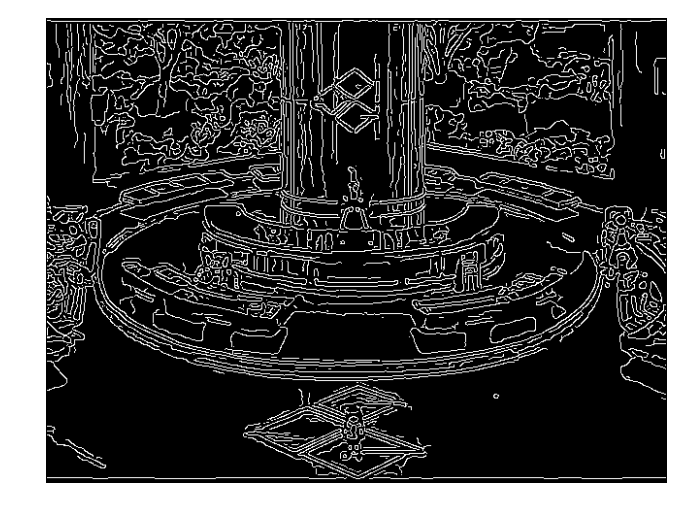
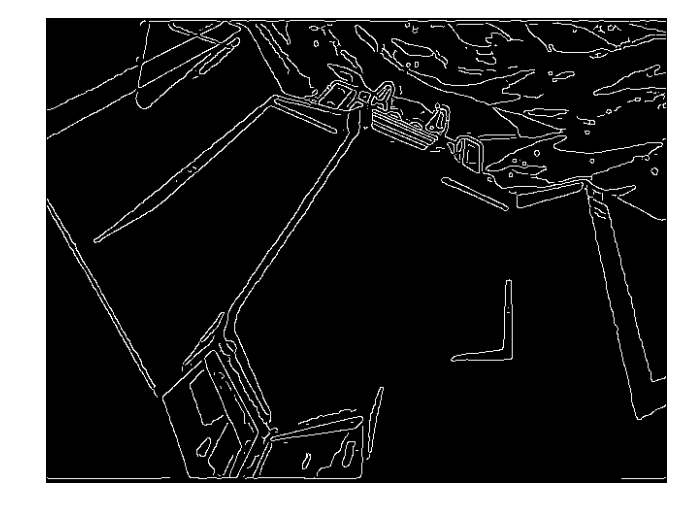
This plot does a pretty good job of showing how backgrounds wreak the current algorithm – the most “complex” images come at the beginning and the end, where background images of the Gutsy Geoid Guard command center lead to frames with fairly simple cels like this (68 seconds):

Turning into a complex image like this (1242 unique regions):
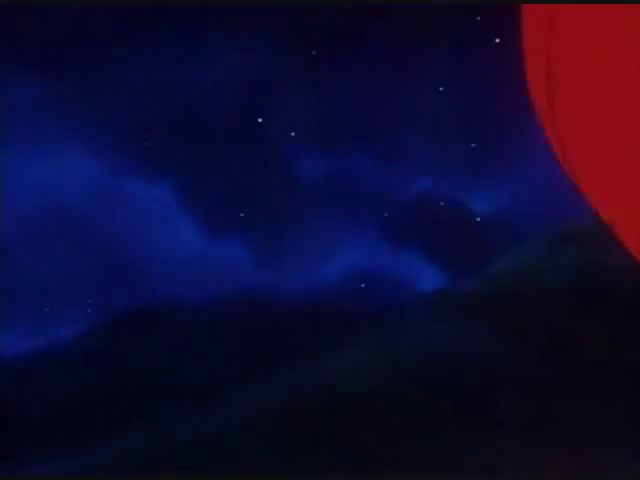
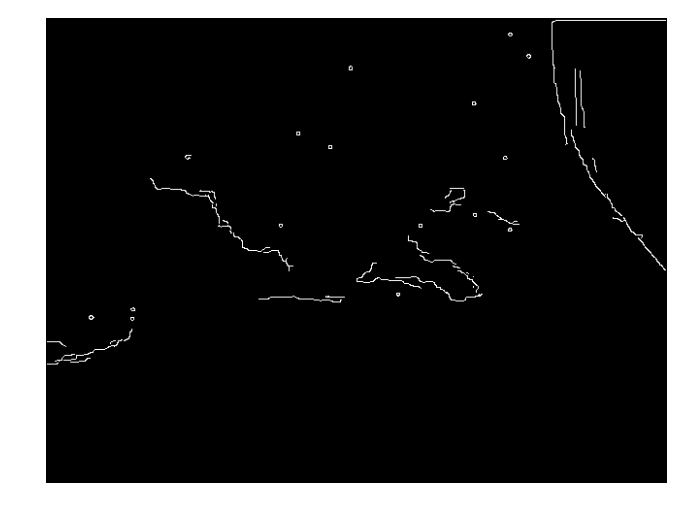
Not all backgrounds result in large region counts – the least-complex smoothed image in the lot comes from 16 seconds in, where the night-sky image is nicely smoothed to have minimal impact:
Anyways, what we’re really interested in is how complex the final fusion sequence is, so we’re going to ignore the frames with background. The copy-pastable portion of that lasts from 0:23-0:66. Here’s a better look at that period:
You can see there are several points showing particular spikes in detail. The single biggest spike in detail comes at the tail end of the sequence (63 seconds, 1227 unique regions), where the triple-G mech is smacking its hands together in a show of force, generating lightning. The mix of the mech detail and the lightning effect make it a detail-heavy image:


Another highlight occurs at the 35-36 second interval (~1030 unique regions on average), where the train slots into a nearly-completed mech against the fluid background of wind and particle effects:


Lulls in the detail occasionally occur when the image contains only a simple part of the mech or the wind background effects, e.g.:

You can see from these images the smoothing isn’t perfect – every image has a few pixels of noise that show up better on the linear images than they do on the original screencaps. But on a macro level, a higher region count seems to match up with more on-screen detail when the backgrounds aren’t actively working against analysis. So we’re at least conditionally in business. If you’re curious and want to take a look at how the breakdown image looks for a cut not mentioned here, I packed the originals and linear breakdowns into an archive you can grab here.
—
I’m still working on refining the fragments of code I’ve scrapped together into something truly capable of doing the kind of second-by-second analysis of episodes of anime I’d like.*** As you can see, it’s all still very rudimentary, and there are very obvious limits on how much understanding this path of investigation will yield even in a best-case scenario. You can’t really put one figure on a transcendent series or scene and expect that to represent the sum total of how it’s going to effect an audience. You’re also not getting a full picture of how difficult a scene is to draw from just its line count – properly capturing motion and making the timing of things seem natural is a highly nontrivial skill. But it always helps to have an extra angle to look at things from. If I make a meaningful addition to my current code, or find a way to use it that I find mildly interesting, you’ll probably find a post about it here.
—
*I was able to mess around with the character designs for Dog Days a bit. Found out the characters in armor have a significantly larger amount of detail in their costumes, especially Leonmichelli:

A solid 572 unique regions in that image, whereas a typical one has a count of a little over 400. Here’s how the humanoid characters from s2 with unique designs compare:
Cinque (school uniform): 278
Eclair: 302
Becky (casual): 328
Millhiore: 347
Percy: 351
Nanami (casual): 355
Violle: 358
Couvert: 366
Noir: 391
Gaul: 399
Jaune: 418
Cinque (hero outfit): 425
Rolan: 459
Yukikaze: 467
Framboise: 467
Callaway: 467
Hina: 475
Liscia: 483
Vert: 486
Nanami (hero outfit): 490
Bernard: 520
Ricotta: 521
Godwin: 563
Leonmichelli: 572
Here’s that set of designs/breakdowns, if you care. Sorry for the long footnote, but I’m damned if I wasn’t talking about them at all after the amount of time that went into that.
**Numerically analyzing each frame in one 24-minute episode takes roughly as long as it would for a normal person to binge-watch a 1-cour anime. Python is not a terribly efficient language for large-scale calculations, but it’s what I know.
***The next obvious step is to build a matching algorithm – the most obvious way to pick out scenes where the anime is relying on stills with lipflap is to simply compare pixels from one second to the next. If 80%+ of the image is exactly the same, there probably wasn’t a ton of animation involved in the shot. Slow background pans would be more difficult to detect (less because of impossibility and more because the first method I thought of would take weeks to analyze a single episode, and the second one would still take days), but that’s two steps into the future and I’m happy just moving the project forward one step at a time.

Is there a tool or code or site that counts the number of cuts and unique frames in a particular episode (of anime)?
Not one that I’m aware of, though a lot of sites archive specific examples of fluid animation. Somebody would have to be pretty meticulous to do this stuff manually, especially with 40+ new episodes of material to analyze in a given week.
If you just want a frame count, there are plenty of ways to use ffmpeg for that: http://stackoverflow.com/questions/2017843/fetch-frame-count-with-ffmpeg
Unique frame counts are a bit tougher, but you can get them by comparing pixels in an image with the next one chronologically. It’s what I’m working on right now – identifying any sort of camera panning/zooming is tough, but you can at least identify when a show is just lipflap and still images.
I’m hoping to make comprehensive statistics on visuals a bit more attainable, but I’m obviously still a ways away.