Due to circumstances largely beyond my control I’ve had little time to work on the analysis of the amazon tracking data. The tracking is ongoing and easy but the writeups are decidedly not, and before I realized it I had 3 full weeks worth of data to expound on.
It’s not all bad – I had some time to do some stuff with the overall US charts and got a significantly better understanding of where the project as a whole stands.
Because of how massive the dataset is this time around, I’m going to mostly skip through the datasets. There are only a very few points of particular interest that popped out of individual datapoints in these weeks beyond the Vampire Hunter D issues discussed elsewhere. Ponyo’s DVD release is included in all plots but removed from all plots because it skews the y-axis.
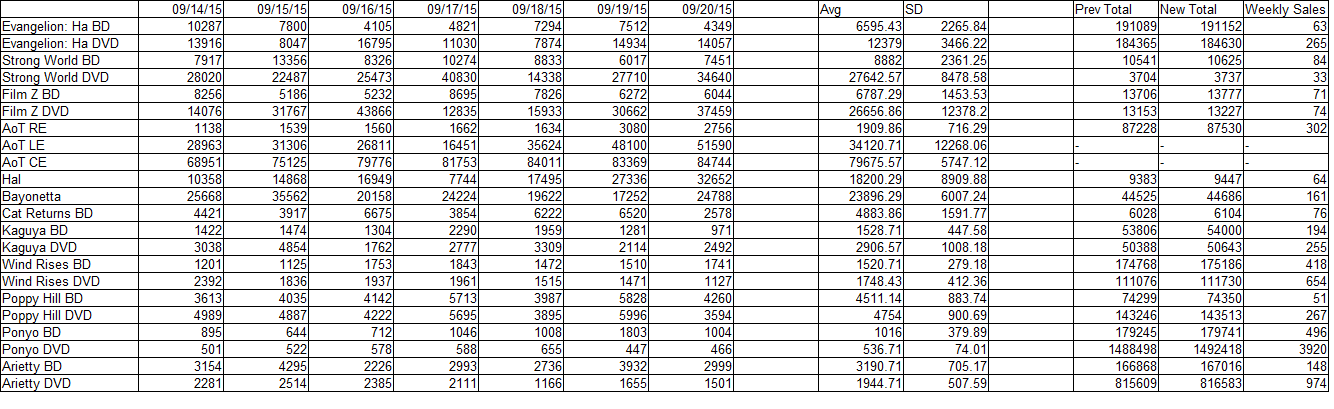
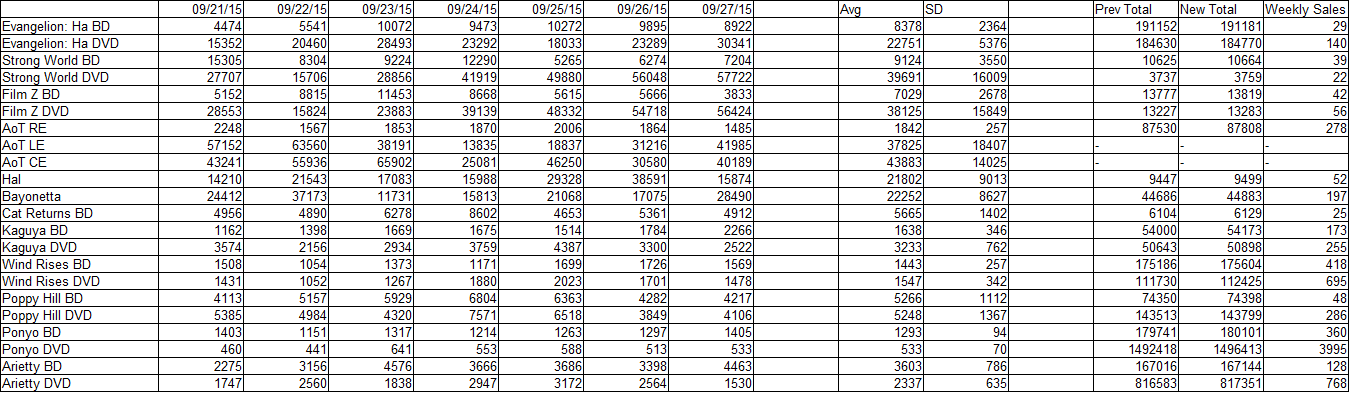
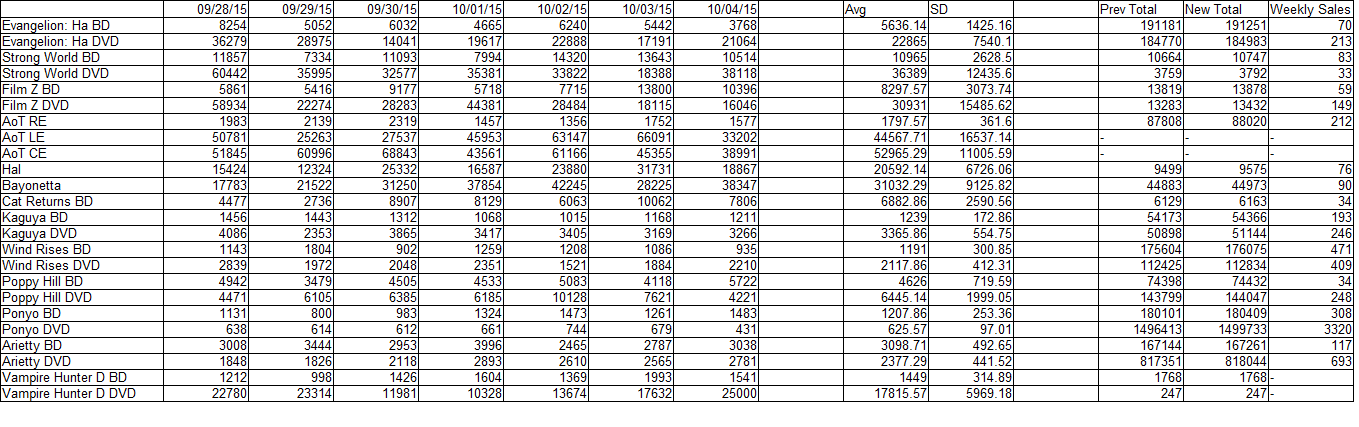
Raw Data:
Week 4 (9/14-9/20):
Week 5 (9/21-9/27):
Week 6 (9/28-10/4):
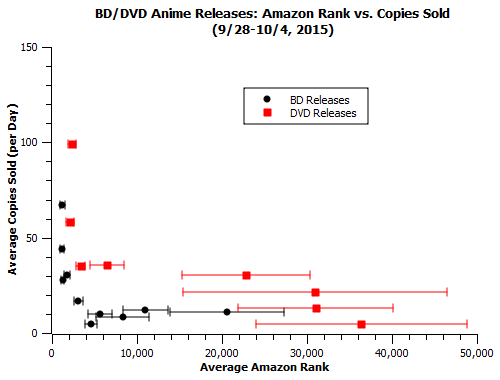
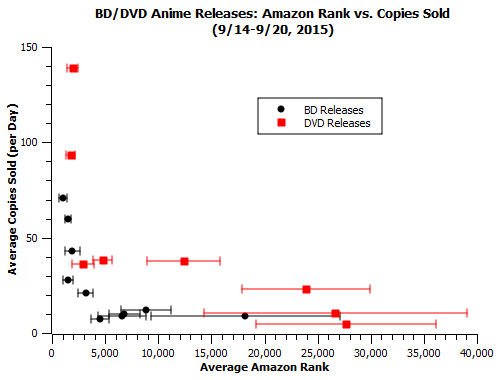
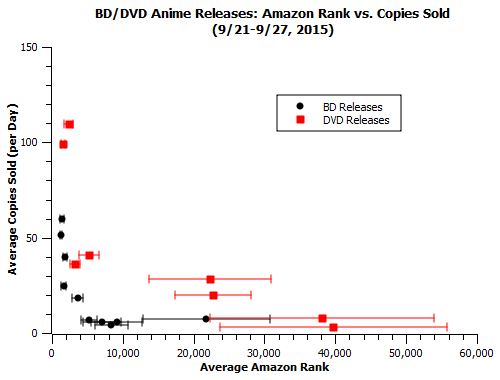
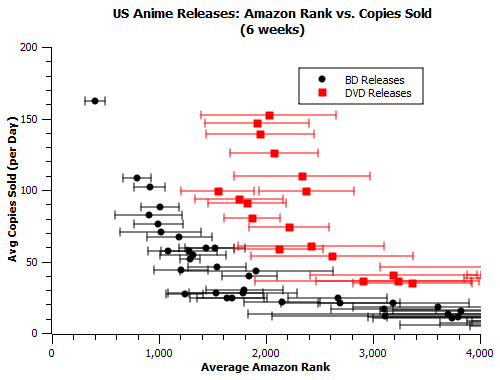
Big Scatterplots (all 6 weeks):
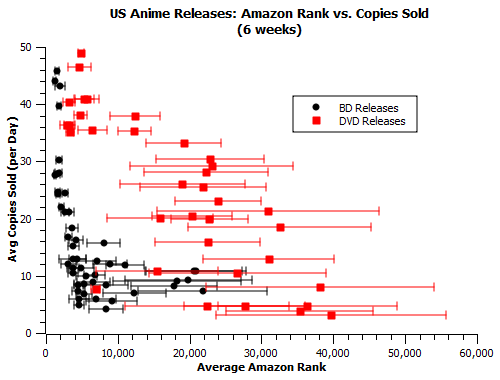
Comments:
-As the weeks of data have piled up, we’ve filled in both ends of the ranking scale, especially for DVD releases, where the ghibli releases have nicely filled in the #1k-#10k range while the less-mainstream funimation titles have flitted around the #10k-#50k area. (BD data is still kinda blank beyond the #20k range). What we see in that previously invisible #10k-#50k area is something we’ve come to expect from months of observation of stock totals – releases that approach #40k in average weekly rank very quickly drop off to a number close to zero copies sold, a number that would likely just be zero if they weren’t averages including the one odd day the release made it up to #10k. This is good confirmation to have about something we were already kind of sure about.
-In the BD sales we observe a sort of v-shaped structure among rank-sales correlations. Around the #5k-#10k range the datapoints show a lot of vertical spread, with series in that zone with similar rankings fetching between 4 and 12 copies sold per day. This spread seems to disappear at larger ranks (#10k-#20k), with the average copies sold for those ranks actually being a bit closer to 12 than to 4. This suggests to me that the #5k-#10k zone is typically populated with some of titles that are over-represented by their amazon rank.
-In the first week, I proposed an updated formula based on the data I had gotten. Now, with 6 times the viable data, I feel comfortable making a fine-tuning update to those values, and adding in a little bit of extra range. R stands for daily rank and S stands for sales. Remember, these are BD values, multiply by 3 to get sales for DVDs.
#500-#1k: S=220-(R-500)*(150/500)
#1k-#2k: S=70-(R-1000)*(40/1000)
#2k-#10k: S=30-(R-2000)*(20/8000)
#10k-#40k: S=10-(R-10000)*(9/30000)
Week/Week Correlations:
For any single given release, we assume that the overall demographics interested in buying it, and hence their buying habits as they relate to “storefront” effects, should be relatively consistent. Hence, for the past several weeks, we’ve been computing Pearson correlation coefficients for the average ranks and total sales of releases across different weeks to see how often worse rank actually leads to lower sales.
Here’s where we currently stand in terms of correlation coefficients comparing the first 5 weeks (week 6 is somewhat anomalous and we’ll get to it in a bit). Remember that a coefficient closer to -1 is strong and a coefficient closer to 0 is weak.
(for the 19 valid datapoints)
w1/w2: -0.46
w1/w3: -0.74
w1/w4: -0.60
w1/w5: -0.60
w2/w3: -0.54
w2/w4: -0.55
w2/w5: -0.63
w3/w4: -0.36
w3/w5: -0.48
w4/w5: -0.52
The values range from -0.3 to -0.8 and are more or less centered around -0.55. This is indicative of a relation which is very real, but also affected by a significant degree of scatter.
Intrinsic Market Scatter:
Now the big-money question here is this: is that value ok? Should I be expecting a correlation coefficient in that range based on the market at large, or does that value indicate a significant misrepresentation of the truth?
Short of being employed at the companies that ship and sell those titles, there’s no way to fundamentally settle that question. But there’s at least one way to get an idea of how that scatter compares to the market at large – how much do overall US video market sales vary from week to week? To answer that question, I used Nash Info Services’ publicly available weekly toplist website TheNumbers and took a look at how consistent the average value of a release in a certain weekly toplist slot was. Specifically, I examined how much BDs in the #10, #15, and #20 and DVDs in the #10, #15, #20, #25, #30 weekly chart positions sold in that week, for each week in the 9 months from January to September of 2015 (39 weeks in total). The average values for each slot are listed below, with the percent scatter in parentheses.
BD10: 17,758 (±51%)
BD15: 11,212 (±35%)
BD20: 8587 (±29%)
DVD10: 37,783 (±45%)
DVD15: 26,609 (±37%)
DVD20: 19,249 (±35%)
DVD25: 16,663 (±32%)
DVD30: 15,251 (±32%)
We see a fair amount of scatter from each of these slots, somewhere between 30 and 50 percent, with some weeks being much further removed from the average than that.
This is playing it somewhat fast and loose because we’re dealing with two different ranges of US home video sales here, but I also tried fitting a correlation coefficient to the various different consecutive slot values – any two points make a line, and theoretically if the correlation between slot and sales is tight, the correlation coefficient for those two values should be close to -1. What I found instead that the intrinsic scatter in these slots was enough to yield significantly worse correlation values:
BD10 vs. BD15: -0.43
BD15 vs. BD20: -0.38
DVD10 vs. DVD15: -0.38
DVD15 vs. DVD20: -0.41
DVD20 vs. DVD25: -0.21
DVD25 vs. DVD30: -0.14
Now, these values are perhaps a bit low because they include linear connections between two points which in some cases have relatively flat slopes, which enhances the effects of scatter. If you plug all the datapoints for each format into one calculation, you get coefficients of -0.54 for BD and -0.61 for DVD.
Keep all the earlier caveats in mind. Just because we’re finding a similar scatter values for amazon ranks and toplist slots doesn’t mean our amazon fit is already as good as market flux will let it be. There are still potential effects (storefront effects, a release being out of stock on amazon, larger numbers leading to more variance for the more popular titles on the toplist, etc.) that can and should be looked at. But this does show that the US video market is a somewhat high-variance dataset on a weekly basis, and we shouldn’t feel at all bad about “only” being able to hit a -0.55 correlation with real sales using amazon rankings.
Week 6 Correlations:
As was mentioned earlier, the week 6 correlation data stands out a bit from the rest:
vs. w1: -0.57
vs. w2: -0.10
vs. w3: -0.47
vs. w4: -0.12
vs. w5: -0.30
As you can see, weeks 2 and 4 do not mix well with week 6, despite generally correlating well with the other weeks in the first 5 (although week 2 did have some issues first covered here). As was just discussed, the US video market has a lot of scatter and occasional results like this are somewhat of an eventuality. Two of them popping up at once merits at least a little bit of detailed analysis, though.
One of the most obvious ways the data could be deliberately thrown off is if some of the weeks were a bit weaker overall. If discs in one week sold a little bit less across the board, then that could affect the fundamental values behind amazon rankings enough to cause a change in weekly sales more significant than any weekly flux in a particular release’s rank. This does pretty much turn out to be the case. The average DVD disc sold in weeks 2 and 4 was about 1.4 standard deviations below the mean for its slot, contrasting with about 0.6 deviations below the mean for week 6. Week 5, with its more moderate correlation, had values about 1 SD below the mean, and values for weeks 1 and 3 were about half an SD from the mean. This also helps explain the previous weakest correlation in the sample, the -0.36 between weeks 3 and 4. Basically this weird stuff is just a result of weak sales weeks giving a system based on averages trouble. Potentially, this same method of analyzing overall sales strength in a given week could be used to weight formula estimates as well.
—
Overall, we’re in really great shape right now. We’re seeing what we expect to see, and what initially seems hugely surprising has a relatively straightforward explanation. If I feel like it, I may get bold and plug some old rank figures into this current formula to estimate how releases did over their first week and first year.
