Part 2 of an ongoing project to investigate what correlation, if any, exists between the amazon rank for US anime releases and their actual sales.
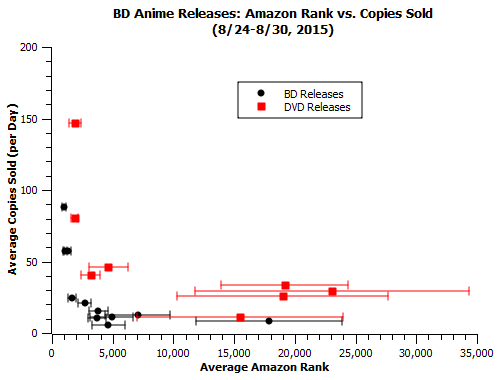
In the previous week’s data, I discovered a general pattern for how series ranking in the #1k-#40k range on amazon were selling, as well as indications that amazon tends to undersell how well DVDs are performing.
In looking at the second week of data, I’m interested in answering two questions related to the strength of that finding.
1) Does the general correlation between ranks and sales found last week still remain in this week’s data?
2) Do changes in the rank of a specific release correlate with an increase/decrease of actual sales, as we would expect they might?
First, a quick word on the sample. Vampire Hunter D, one week post-release in this dataset, is now definitely not affected by preorders and can be plotted along with the other datapoints. Second, I’ve seen nothing that makes me want to take The Cat Returns, which lost copies compared to its total last week, out of the proverbial doghouse. It’s still being tracked, but I find that data extremely suspect and will be unlikely to use it in the future until I get some explanation for it.
Raw figures:
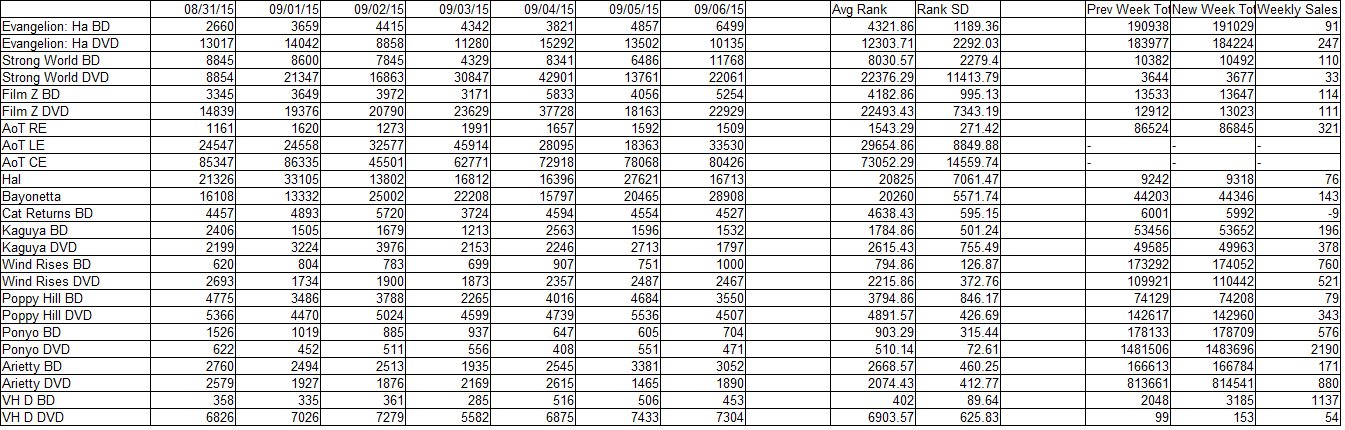
A couple of individual notables in this week’s data:
-Ponyo didn’t sell quite so much this week, and this is reflected in its poorer amazon rank.
-Vampire Hunter D on DVD seems to have a very weak storefront presence relative to other DVD releases.
-Vampire Hunter D on BD sold about half as much as it did on release week, around a thousand copies. This is the best performance for a BD release this week, but it is in many ways weaker than one might expect. The first BD release I’ve ever seen rank sold over 7000 copies on release week (possibly heavily preordered and/or storefronted). The Wind Rises also sold two-thirds as many copies with a rank twice as high. Given the steep slope we’ve previously seen low-number ranks to represent, it’s possible the release leaned quite a bit towards amazon sales.
-Speaking of which, the Wind Rises broke into a triple-digit average on BD, and also coincidentally pushed its weekly sales numbers up.
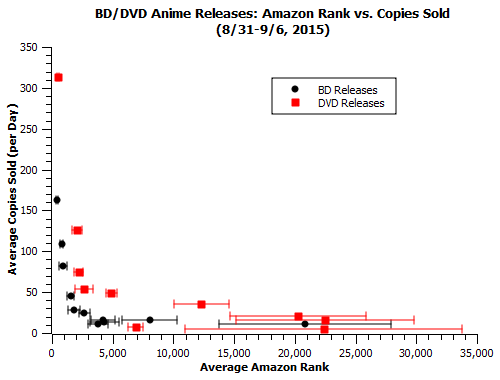
In general, we see the curve has a similar shape to that of last week’s. But this is mostly just a rehash of what was done last week. Let’s get to the interesting part…
Changes in individual titles:
The fundamental assumption driving amazon tracking is that a title’s amazon strength is reflective of its overall strength in sales. The data above certainly indicates that may be the case, but another way we can check is compare different weeks for the same title – did it sell better when its average rank was closer to #1?
Answering this question on a macro level presents some difficulties. While the differences in sales from week to week are fairly straightforward bits of data, the differences between amazon ranks are clearly non-linear. Namely, there’s a lot more difference in sales between the #1 and #100 spot than there is between the #10,000 and #10,100 spot. How, then, do we decide what is and is not a significant difference in rank?
I’ve elected for a method that makes use of the standard deviation (SD) in rank over each of the two weeks. Essentially, higher-rank numbers are more likely to have a wider spread, so a 500-spot difference in rank will matter more for a number with 4 digits than it will for one with 5. And the more standard deviations a rank shifts, the more significant the shift.
The specific variables I use to calculate change in rank and change in sales are as follows:
-dR (rank difference): (Rank in Week 2-Rank in Week 1)/sqrt(week2SD^2+week1SD^2)
-dS (sales difference): (Sales in Week 2-Sales in Week 1)/(0.5*(Sales in Week 1+Sales in Week 2))
If all goes as expected, we should expect to see a strong negative correlation between these two variables. Again, sales go up as rank approaches numero uno. Vampire Hunter D, is excluded from this sample, as its previous week was a release week with a potential for preorder effects (these would help them fit the correlation, but we don’t want a tainted conclusion). In total, we have 19 releases’ worth of clean data to compare.
In comparing these shows across weeks, I thought it would be useful to examine not just a show’s overall weekly average rank, but the strongest days of that week in particular. In playing with this sample, I applied forumulae that computed dR by weighting all days equally, weighting its best 4 days more significantly, and weighting its best 2 days more significantly. I found the 4 day model (shown below) best represented releases which had stronger peaks than flat averages might suggest, though the results plotted below are qualitatively the same for all 3 models.

There is definitely some good news! The data fits to a negative correlation like I hoped it would. The bad news is that it’s hardly a correlation with a perfect slope. The data fits, at best, a -.45 slope if you neglect VHD’s release to post-release transition, about a -.35 slope with that. When amazon rank numbers decrease, they do certainly seem to correspond to a notable spike in sales.
When they increase, though, the meaning of the rank is less certain; it could mean anything from a dip in sales to a slight rise. Even so, the rises in sales that actively defy the expected negative correlation are smaller shifts on the order of 20 or so copies per week, not a large difference given the scatter often involved in day-to-day ranks. For comparison, many of the shifts for releases behaving predictably here are well over 50 copies per week. The chief cause of that imperfection is the uncertainty in the effects of a rise in rank number is likely due to a combination of the impacts of non-amazon shops and small day-to-day variance in the meanings of rank numbers. Overall, this result is pretty good news for an amazon fit that aspires to factor-of-2 accuracy.

What’s the R-value of the last scatterplot?
Does average-of-rank even make sense, when your assume ranks are logarithmic?
The R-value for the 4-day weighted average vs. weighted sales change in the last plot is -0.53.
As for the ranks, I have no definite conviction as to how exactly they relate, but the relation between ranks and sales is almost certainly not logarithmic. I’ve tried out a bunch of different fits to this and other data and a chiefly logarithmic model fits poorly. In an ideal situation, with buckets of hard data, I’d build a histogram for each individual amazon rank number and not worry about any kind of general fit. Currently I’m going with piecewise linear fits with varying slopes, which are a compromise between that and the need to fit the entire range of possible ranks with a still-limited data pool.
The underlying issue is that I get weekly sales data and I get daily amazon ranks and I have to have a way to compare the two. Averaging and noting scatter+particularly strong individual day-performances in a given week is a simple way of achieving that necessity. So long as there’s a starting point, I can use that to make simple fits and correct them over time as more information comes to light.
I could make a bunch of Ansatzes about what the amazon distribution might be and plugging them all into the 7-day data vs. results with a certain degree of allowed scatter, but that’s a complicated method which would not necessarily yield an appreciably better result if my Ansatzes were wrong.