One my long-term goals with this site is to gain as much insight into the current state of home video sales in the US anime industry as I can. To that end, I’ve been tracking monthly releases and how they rank on amazon, as well as the sales totals for those that make the Nash Information Services charts. Recently, I’ve stepped up my efforts with a script that makes it efficient to track large numbers of releases and access to the full Nash DB via OpusData. In particular, I’ve had my eye on a bunch of releases in the database which are still moving copies on amazon, and thus offer an opportunity to check the correlation between amazon ranks and sales at various levels of success.
Now that the Nash Information Services database has been updated with data for that week, we can start to take those numbers and try to dissect what they mean. As a happy accident, Vampire Hunter D’s rerelease charted in the same week and we can include that bit of data from late-August tracking as well.
Before we start on the new data, I’d like to emphasize at the outset that I’ve learned from looking at their full database that Nash Info doesn’t always track releases, even when they nominally fit the qualifications to be tracked, TV or movie or otherwise. This solves a lot of issues (see Steins;Gate box, Space Dandy) which faced previous tracking assumptions.
The Raw Data:
There’s a ton of raw data in play here – 7 days of ranks for each of 24 releases, plus the before and after sales for each one. The complete collection of info looks like this:
For the moment, I’ll be crunching this complex set of data into 3 numbers – the average daily amazon rank, the standard deviation in rank, and the weekly sales divided by 7. This is an attempt to roughly reduce the data to how much a given rank corresponds to copies sold per day. As we will see later, the assumption that we can just use average rank rather than the 7 individual daily ranks is not entirely correct, but it’s a good place to start.
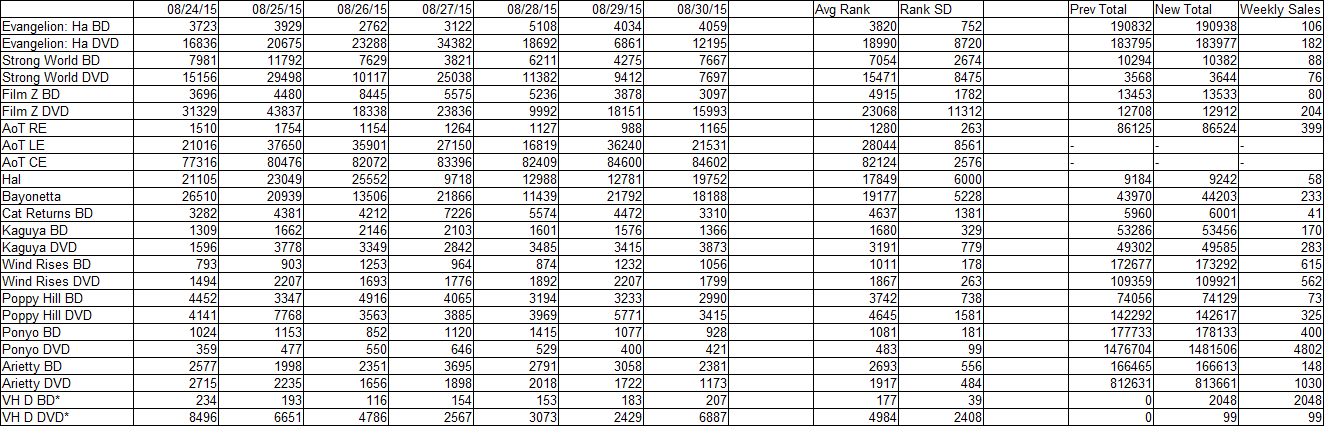
The following plot represents said figures for the above entries visually, save for the alternate editions of Attack on Titan (negligible ranks relative to the regular edition, mainly tracked just so we could know where they stood) and Vampire Hunter D (release week, possibly affected by preorders). Note that Ponyo’s DVD release is way above the rest of the pack, selling about 700 copies a day at an average rank around #480:
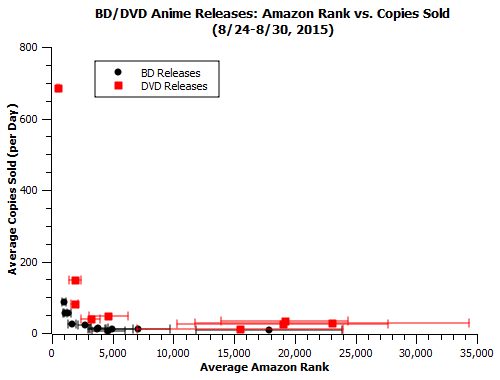
Here’s the same plot, but with Ponyo on DVD excluded to allow more detail on the lower sellers:
What immediately pops out at you in both of these graphs is that, for a given average amazon rank, DVDs are selling 2-3 times as much as BDs. This is trueboth for releases with BD/DVD combo packs, and ones like One Piece Film Z where the BD and DVD releases are entirely separate. The one exception there is One Piece Strong World.
You’ll notice that, for the most part, the lowest-selling BD titles were moving around 10 copies a day. The lowest seller and one exception to this, Neko no Ongaeshi/The Cat Returns, is a weird datapoint. While its sales increased in this first week of tracking (ending in August 30th), in the next week (ending in September 6th) its sales total went *down* by about 9 copies. For the time being, I’m treating it as a potentially irregular case and excluding it from attempts to fit a general curve to the data.
Exclude that datapoint, and the lowest-selling BD release is Hal, which also has the lowest average amazon rank in that subsample, sold about 8 copies per day.
Breakdown:
There is always the theory that this ain’t nothing and extreme day-to-day variance over the course of a year, as different movies exert different amounts of influence on what the rankings actually mean, is critical. There’s also the theory that alternative shops for anime play a big enough role in the sales of most major anime releases that amazon isn’t a particularly useful barometer. In either of those cases, amazon ranks will end up being of limited usefulness as a predictor, and I can’t rule either out based on the data I can collect.
At the very least, I can say that there is NO Significant evidence that one day of the week is particularly sales-dominant. I’ve tried weighting the average rank towards different days with none of the weighted models show a knockout correlation superior to the general averages.
There IS evidence that, for releases with similar averages, the one with more days at a higher peak wins out. The Wind Rises on BD spent 4 days in triple digits, versus 2 days for Ponyo, and the former beat the latter by 215 copies despite the fact that their averages were within one SD of each other. The same phenomenon pops up with Arietty DVDs (extreme sunday outlier) versus Wind Rises DVDs; Arietty peaked at ~#1200 on Sunday, a good 300 spots higher than Wind Rises’s high-water mark this week. This relation is one I hope to be able to explore in detail in the coming weeks as I have more compartmentalized data for each release.
If we *do* assume that we can take the weekly amazon rank average and say they account for a certain range of sales from amazon itself, there are a couple of potential threads that emerge. That range can be pretty broad – we’re just really trying to beat the baseline of knowledge we have about how US anime releases fare, so the bar is fairly low. I’d be ecstatic with a formula which could get within a factor of 2.
In brief, the surface level takeaways are as follows:
-DVDs sell much more than BDs with a given rank.
Pretty clear from the graphs. Maybe BD customers are less discriminating about where they shop, or maybe amazon offers comparatively better discounts on BD releases as they liquidate stock over time. Regardless of why it happens, it’s pretty clear there’s some lean in that direction.
-There may exist a moderate “storefront” effect between brands
Funimation titles seem to get a little more “storefront” (purchases from non-amazon stores manifesting as better sales for a given title), while the Ghibli BD packs seem to get less storefront. It’s possible that sometimes get counted as DVDs (though that’s not a one-assumption solution). If it is true that storefront totals vary by brands, that’s interesting. Given the choice, I’d be significantly more inclined to use whatever fit I’d use for funi titles for the other companies’ releases (Section 23, Discotek, etc.), given that those are on the side of releases meant less for the general public. That doesn’t mean it’s necessarily a good assumption to make without being able to back it up – all 3 brands are different and market differently, and that may be reflected in their respective sales distributions. As a low-seller from a different distributor, Vampire Hunter D’s long-term numbers may be somewhat illuminating in that regard.
—
Current Best-Guess Formula:
This is a really rough daily rank/sales fit, based in part on previous knowledge and in part on some examination of this week’s data. I’m not speculating about ranks higher than 1k for now – I’ve already had data on that for some time. The big thing that comes out of this data is a split between BD and DVD correlations. Since DVDs do better for a given rank, I’m doing the formula for BDs only. To get DVD sales out of the BD formula, you multiply the result by 2.5.
For BD sales, I’m only fitting for 1k for above, and breaking the correlation up into sections which split into 1k-2k, 2k-5k, 5k-10k, 10k-40k. I’m connecting those areas with piece-wise linear fits. 40k and worse has been shown to indicate less than one copy sold per day. There is no BD data in this sample for 1k or better aside from the VHD numbers, which could still be affected by preorder totals.
The BD formula breaks down as follows (S is daily sales, R is daily rank):
1k-2k: S=60-(R-1000)*(35/1000)
2k-10k: S=25-(R-2000)*(13/8000)
10k-40k: S=12-(R-10000)*(11/30000)
This is definitely a work in progress. Fortunately there will be plenty more datapoints to test the formula against when the time comes. Some of them are already out – in the time that I was editing this article, next week’s data came out. Stay tuned for an updated look at how slight change in weekly rank changes sales for a given title.
