Since the most recently available week of Nash Info Services data allowed me to really fine-tune my prediction formula, I figured I was about ready to put it to the test on amazon data and actually predict some US anime sales. So I set out to do so on 3 months’ worth of year-old releases, picking months with releases I have concrete year-one data for. Seemed pretty straightforward at the time.
…Turns out it’s never that simple. There were a couple of factors I had to consider when trying to make truly complete estimates. But with some fast and loose statistical gamesmanship, I was able to get some estimates. This time around, I have substantive reason to suspect they’re pretty good.
The majority of this article is probably gonna be a pretty think read for someone who doesn’t care much about my methodology. Skip ahead to “Predicted Sales” if you just want the results.
Market Life Cycle
At the most basic level, I assume each release has 3 different distinct phases of selling:
1) Release – The first week, when preorders and pre-release hype send a series to what is generally its highest ranking.
2) Post-release, pre-saturation – Time between release and the time it takes for most people who had seen the show prior to the release to find out the release has happened.
3) Saturation – Most who were predisposed to buy the disc have done so, now customers are “new” fans created since the disc came out.
For this model, we assume phase 3 generally sets in at around 1 year and accounts for a relatively small percentage of the sales total, and that phase 2 is relatively flat in terms of daily sales. From there, we take one day’s worth of sales data for phase 2 (generally from the last day of the period I tracked it for) and multiply it out over the rest of the year.
Important Note: Because my tracking periods have ended with 6 days after the final release of the tracking period, this is likely to cause some inflation of the predicted year-long totals for titles that happened to come out in the final week of the month. When I show them, I will highlight those estimates in red.
Technical Note: For releases with ranks regularly over #10,000, the increased wobble in day-to-day position makes it harder for one day to be a good representative sample of the period. For those releases, I use the average of the last 7 days of the tracking period.
That’d mean we’d be multiplying our guess for one phase 2 week out by 51 for each week remaining, right? Nope. There’s a pretty obvious yearly anomaly in the US market that has to be dealt with on the way.
The Holiday Season
November in America means a lot of things – discounted Halloween candy, enduring the worst parts of your extended family for 2 to 4 days, and Black Friday stampedes of people buying thousands upon thousands of discounted items across the US. Home video sales are by no means excepted from that phenomenon. On average, the number 30 DVD on the US charts in any given week moves around 15,000 copies. The week of the most recent Black Friday, the number 30 slot was good for 112,150 copies sold. Sales stay at levels 3-4 times the average levels and don’t really dip back to normal until early January. Based on its effects on the top-30 market over those weeks, it’s likely the holiday weeks account for about 19 extra weeks’ worth of sales.
We don’t know exactly if or how this yearly surge affects anime compared to the rest of the market, and it’s not trivial to assume anime is affected more, less, the same, or at all. In the absence of contrary evidence, I’m going to assume anime is roughly in sync with the rest of the market, and add those 19 weeks’ worth of sales onto phase 2. That makes it a round 70 “weeks” we’ll be counting.
Formula: Ranks into Sales
The data I have on these releases is not actual sales data, but their amazon rank data. I’ve spent a long time trying to find a good correlation between the two. I hammered out a workable conversion for the top 500 over my first year of tracking, and the ranks above that just recently. The conversions used are listed below, where S stands for daily sales and R stands for amazon rank.
R<100: S=11000-(R*10000/100)
100<R<500: S=1000-(R-100)*(780/400)
500<R<1000: S=220-(R-500)*(150/500)
1000<R<2000: S=70-(R-1000)*(40/1000)
2000<R<10000: S=30-(R-2000)*(20/8000)
10000<R<40000: S=10-(R-10000)*(9/30000)
A rank between 40000 and 50000 is worth 1 copy per day in the long-term estimates only. Otherwise, any rank worse than 40000 is worth nothing.
If a release is a DVD, its estimate is triple what is listed above. This category includes all releases listed as being DVD-format on amazon, plus the Bayonetta movie, which is tracked as a DVD in the Nash Information Services database.
Important Note: Due to the fact that the formula breaks down around ranks of 40,000+, I can’t do estimates for releases ranking consistently below that level, so I’m listing their estimated sales as 0. In reality, a zero prediction represents an actual number likely between 0 and 500 (for BDs) or 0 and 1500 (for DVDs).
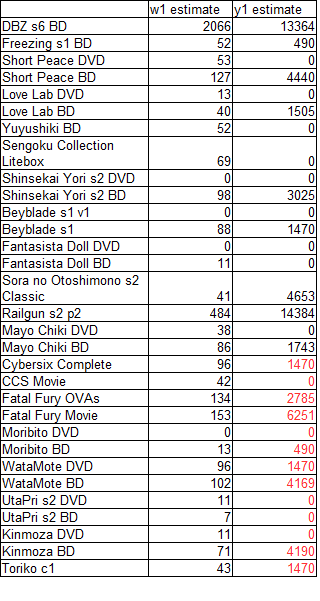
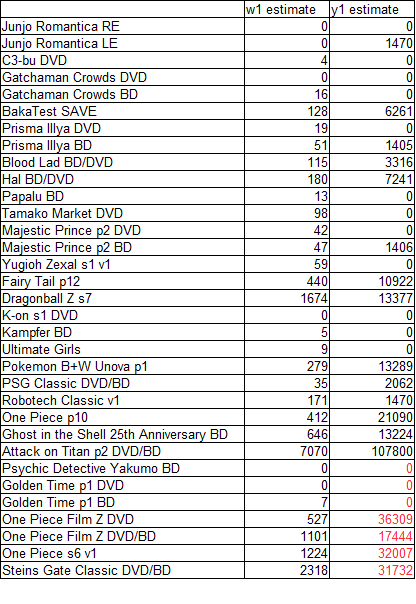
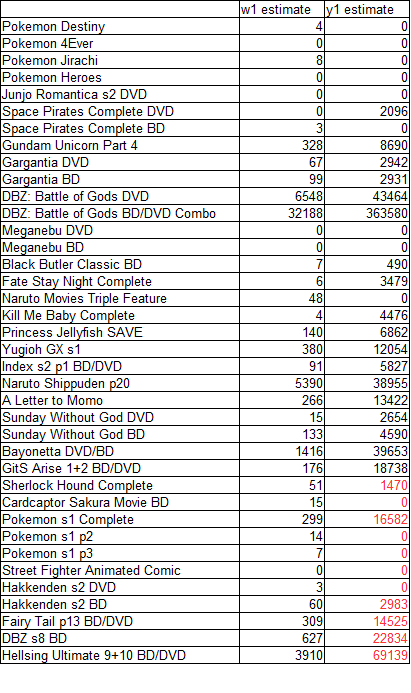
Predicted Sales
(If you’re confused about the shorthand I’ve used for releases, check the link above the spreadsheet. It’ll take you to the original page with links to each release’s amazon page.)
—
Notes:
-One of the first things you do with any cool method before you get too excited about it is take a look at how well it predicts reality among the cases you already know about. Thankfully, we have a total of 6 releases/8 cases where we have either week 1 sales or 1-year total sales available for comparison. Let’s see how they stack up!
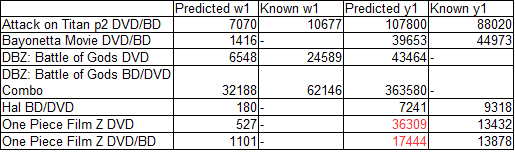
6 out of the 8 releases are predicted at within 50 percent of the known value! Given the assumptions baked into the model, and the rather large intrinsic scatter of the amazon-sales correlation, that’s a pretty great result. Among those, it seems like the year-long estimates are about where they should be, and the week-one estimates are slightly lower.
The two that don’t match up well to their prediction are DVDs released at the same time as DVD combos – DBZ: Battle of Gods and One Piece Film Z. The first prediction is way low, and the second is way high, so it’s not a consistent one-way thing. But the One Piece Film Z DVD is from the end-of-the-month part of the sample that extrapolates out of release week data. My theory? DBZ is underestimated by about half because the #50 and better ranks are harder to peg to an exact number, OPFZ is overestimated long-term because of the release week timing, and both are vulnerable to “combo counting” (DVD/BD combos getting counted as either BDs or DVDs, depending on who does the reporting). Double the DBZ predictions, halve the OP ones, and shift some 30% of predicted BDs for DBZ into the DVD column and you’ll get numbers a lot closer to the known values.
I just read that paragraph back and it’s pretty disgusting with wild guesses. But it feels right.
-Another note about One Piece Film Z: its predicted week 1 total was around 1500, but this total was reported way higher at a bit over 6k. That’s a 75% underestimate. Not cool, though preorders can get you part of the way there, and assuming storefront from more engaged RightStuf/Funimation shoppers is stronger earlier on for certain titles can get you further, but that’s still a ways off. The other w1 comparisons point the same way; I think preorders in general are gonna show themselves to be more important the more data we get on upcoming new releases. I have a bit more confidence in the year-long figures as currently computed.
-That said, boy are the long tails (as currently calculated) the most important part of the sales pie. Looks very different from the Japanese market in that respect, and I would bet a lot of that structure is due to more limited marketing for niche releases.
-At a glance, mid-tier Funimation titles seem to have yearlong predicted totals that generally fall in the 10k-20k range, while Sentai titles seem to do regularly do between 1k-5k. It’s hard to pin Sentai’s range down exactly because more of them hit the low-rank floor where my stuff is still useless. This seems to corroborate Twitter-quote sources which pegged Sentai’s 1k break-even/3k hit sales guidelines and that that number was too small for Funimation.
-Given how well Vibration seemed to do a year later, one might be surprised by how Freezing s1 seems to plop here. Something’s interesting there. Did this season have a really strong tail for some reason? Nope, the real reason is that the version here is a discount rerelease of the original, which was first released in August 2012.
-I try to find an individual sales result in these predictions that, if correct, would make me excited that series X did well. It’s whatever, cause these results, though uncertain, are still academically neat.
