The holidays may be over, but we’re still dealing with pre-shopping season data here at the US amazon formula lab. This batch of data is the last one from before Black Friday, and also includes DBZ:F DVD data for the first time. I’ll also take my first stab at using newer data to guess at the top of the amazon rank scale.
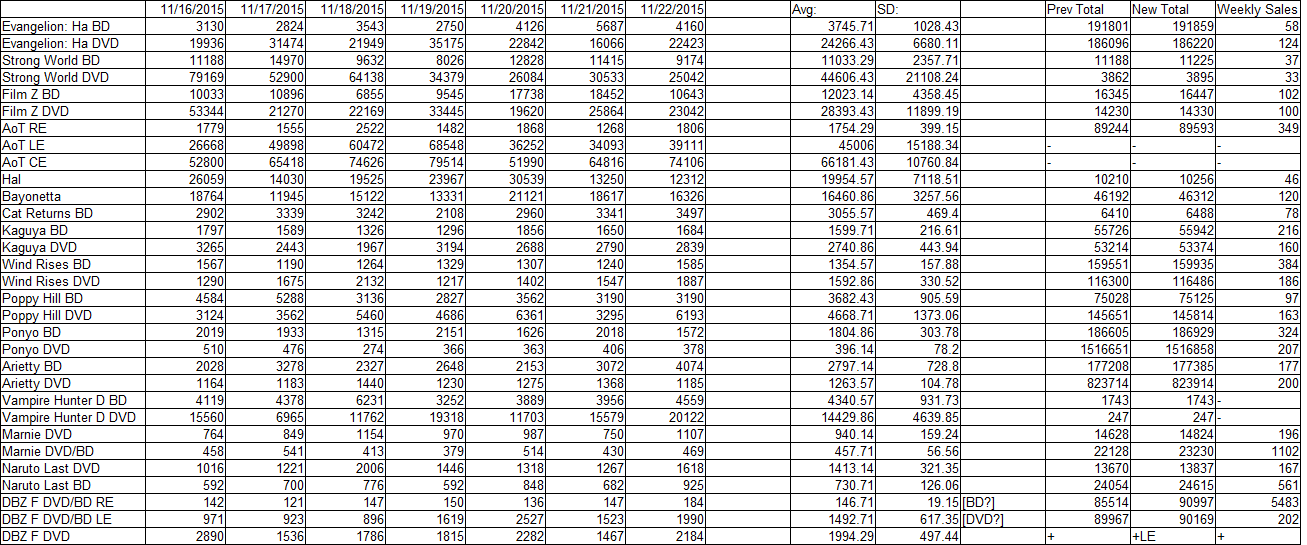
Raw Data:
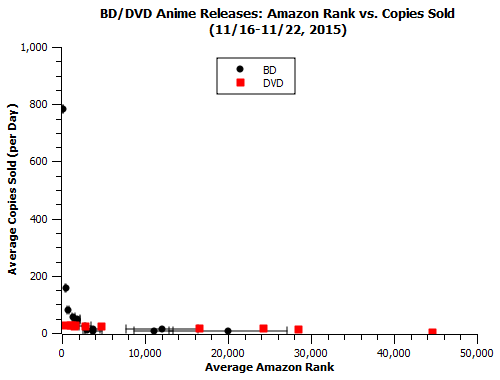
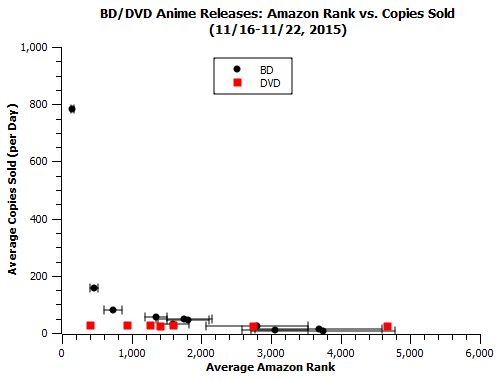
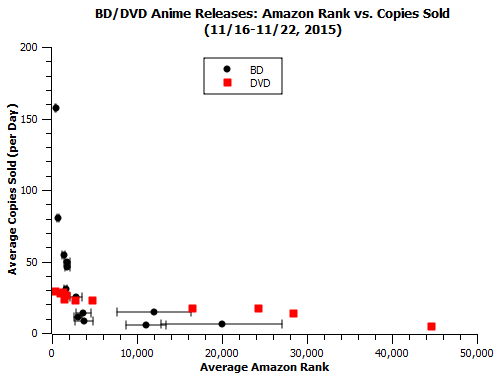
Charts:
(Data given on 3 different axis ranges to highlight different regions)
(DBZ:F on DVD excluded owing to uncertain splits)
Comments:
DBZ:F DVD Tracking Begins:
-This is the first week where we can directly compare DVD/RE/LE data for DBZ:F, and the results aren’t super-illuminating. LE and DVD ranks seem pretty close, and RE sales continue to stand out as being way bigger. Don’t have a lot to say there.
A Temporarily Flatter DVD curve?
-DVDs ranking better than #5000 behaved weirdly this week. Specifically, they behaved as if their ranks mattered on a very flat curve; Ponyo at #400 moved 29.5 copies a day, Poppy Hill at #4700 moved 23.3 copies a day, and each of the 5 releases between those two moved something in that range. One only has to look at the past couple of weeks to see that this is highly atypical behavior, likely due to some non-amazon store factors.
Sub-100 Amazon Formula:
-Because of preorder complications, it’s been tough to set up a formula to predict the values of amazon ranks at the top of the scale. My early BD curve (which still seems fairly accurate) was limited to ranks outside of the top 500:
#500-#1k: S=220-(R-500)*(150/500)
#1k-#2k: S=70-(R-1000)*(40/1000)
#2k-#10k: S=30-(R-2000)*(20/8000)
#10k-#40k: S=10-(R-10000)*(9/30000)
For the past 3 weeks of sales, the DBZ RE has put up the following rank-daily sales values:
w11: #49-1287
w12: #114-1095
w13: #147-783
But from previous Marnie and Naruto BD data, we know that ranks of #200 roughly correspond to about 250 copies sold per day. So, assuming all this data fits together and contains no anomalies, the value of the slots all the way down to #50 can be approximated by something like this:
#200-#500: S=250-(R-200)*(30/300)
#150-#200: S=800-(R-150)*(550/50)
#100-#150: S=1000-(R-100)*(200/50)
#50-#100: S=1300-(R-50)*(300/50)
These high ranks are pretty variant and this is definitely not an exact solution, but this represents the shape of the data we have that’s more independent of release-week preorder/initial shipment data.
—
Well, this is the last week of ‘normal’ data we’re likely to see for a while, as the holiday buying season kicks into full swing with the next batch of data. I think we’ve got a pretty good baseline and should be able to make something out of that incoming influx of information.
