Quick recap: I’m taking a look at various no-cost indicators of popularity for anime and their related goods. First, I’m checking how well they correspond to disk sales by checking whether different applications of that statistic beat the null “every v1 will sell less than 4000 disks” accuracy criterion for a given season (66% for Fall, 59% for Summer). Later I’ll check how well these indicators corresponded to boosts in manga/LN source popularity (for works that were originally LN/manga), to contrast their predictive abilities at both high-cost and low-cost levels of interest.
Google traffic offers a neat and fairly intuitive, if sometimes difficult to standardize, way of checking the popularity of shows, but it needs to be tested as much as any other stat. If you want to see the google data this check is based off of, it’s here. The doc where the checks were calculated is here, and the checks themselves are summarized below (numbers beating the null hypothesis shown in green):
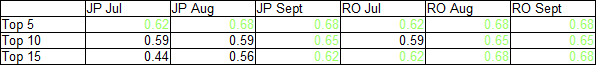
While top 5 rankings bested the null hypotheses across the board, other more inclusive checks took a little while longer to become precise. It’s possible that that’s just some imperfections of the indicator showing, or that Summer saw more fluctuation in interest as the season wore on than Fall did.
