Part 3 of an ongoing project to investigate what correlation, if any, exists between the amazon rank for US anime releases and their actual sales.
When I first conceived of this little amazon tracking expedition, I envisioned it as a 3-4 week excursion at most. At the time I was pulling up numbers individually and inputting them into spreadsheets, and it seemed like it would be a stretch to do so for a prolonged period of time. All the more so because this would be happening in September of 2015, one of the largest months I’ve ever tracked containing a massive total of 44 releases. Add in the 22 releases on the special list, and that’s a few minutes a day more than I was used to spending on this little sub-hobby.
To make the task significantly less obtrusive, I wrote a script that does the retrievals for me at a leisurely pace of one page rank per second (so as not to appear as an attack on amazon’s servers). This has since paid exponential dividends, saving me hours over the course of a month and making it possible to continue long-term tracking in perpetuity. And as this week’s worth of data (from 9/7-9/13) shows, it will be very helpful to have those extra datapoints.
Raw figures:
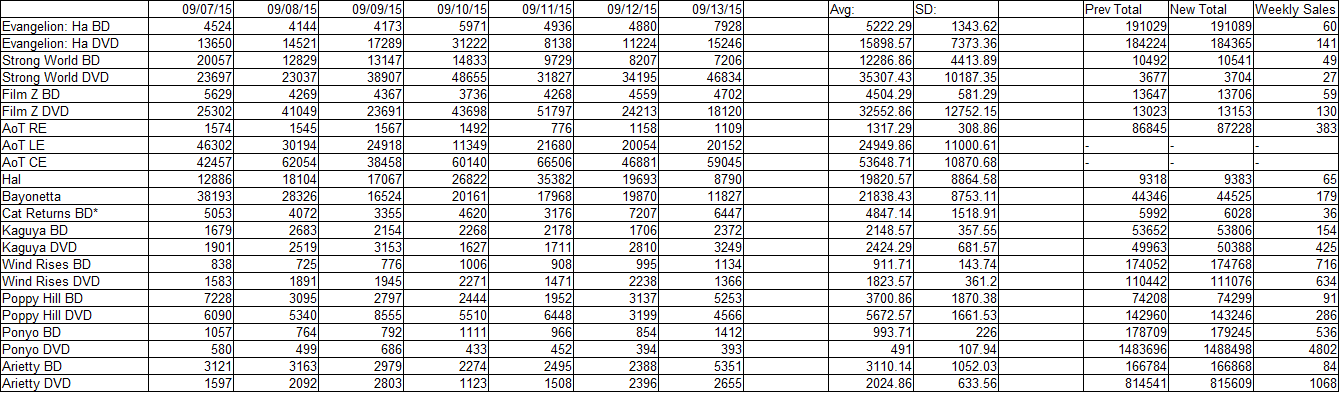
Notes on this week’s data:
-The Cat Returns’ total went up this week, which is I suppose good, but I’m still a little loath to trust the accuracy of that figure. We don’t know which end of the week2 data might be corrupt, and one of them stretches into this week.
-Both One Piece film DVDs had a very poor ranks this week. Strong World continues to have numbers which contrast with the usual DVD storefront effect.
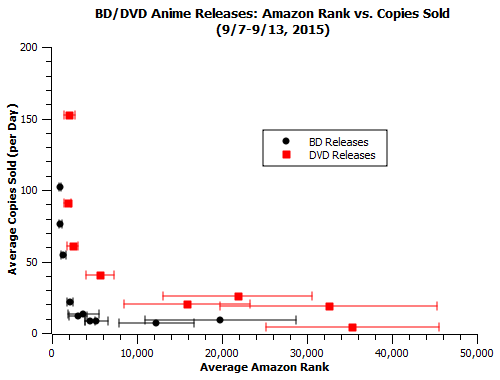
-Ponyo’s back in the stratosphere this weekend, doing over 3 times better than any other release. I excluded it from the plot because it skews the axis too much:
Changes in individual titles:
One of the key ways available for us to test the strengths of amazon ranks as a predictor is the comparison of same-release ranks across multiple weeks, and how much effect they have on the sales outcome – when the rank gets better or worse by a large amount, do sales change accordingly? Last time, I outlined the method I used to normalize ranks and sales for comparison across weeks. This time, we have 3 total weeks of data, so we can run 3 comparisons – week 3 vs. week 1 and week 3 vs. week 2. Adding that to last time’s week 1 vs. week 2 data, that’s a total of 57 total datapoints we can compare. Because of the way ranks work, we expect this correlation to have a negative slope.

It was correctly pointed out to me by reader primadog that R-value/Pearson Coefficient is a more accurate way of determining the likelihood and strength of correlation. Since this correlation is a negative one, a value closer to -1 than 0 indicates a strong correlation.
I calulated R-values for each of the 3 week vs. week samples, and I was quite surprised to find an odd element. The week 1 and week 3 data correlated with an R-value of -0.79, very strong for a real-world dataset. However, both the comparisons involving week 2 data had R-values weaker than -0.6 (0.50 vs. week 1, 0.58 vs. week 3). So the correlation between the data for week 1 and week 3 is quite a bit stronger, and the correlation of either set with week 2 data is comparatively vague. Compounding this observation is the fact that this isn’t the only weird thing about the week 2 data – The Cat Returns’s BD rerelease *lost* copies from its lifetime total moving from week 1 to week 2.
We have to at least consider the possibility that it wasn’t simply a hiccup in the one datapoint, but the result of a small but noticeable system-wide issue. In the least-damaging case, numbers were both added normally and corrected for a long term overcount, resulting in the one observable net minus and a few less noticeably “off” values. It’s also possible that all totals given on week 2 could be pure miscounts, meaning we have to discount that data, as well as w2 vs. w1/w3 data. Fortunately, thanks to the fact that we’ve got mountains of weeks’ worth of data incoming, we are well equipped to both discover if the week was a notable outlier and to exclude it if it turns out to be. Obviously it’s preferable to be able to use as much data as possible, and I’ll include week 2 data in future analyses unless further returns on the project cement its outlier status, but the fact that we don’t *have* to rely on data if we have obvious evidence that it’s contaminated is a huge boon to the project.
