In a previous post made approximately forever ago, I tackled the idea of “churn”; that anime fandom was constantly gaining new fans and losing old ones, at a rate high enough to cause significant institutional memory loss. Long story short, it turned out there was a distinct, cliff-like loss of popularity corresponding pretty closely with the introduction of Blu-Ray to the market in 2007-08, but not a constant one over time.
Here’s another angle on the idea, though: there may not be a constant change in popularity, but what about rating? Are people giving newer anime higher scores in general? That’s what I’m going to examine here.
It’s prudent to mention before we begin that no season is truly hit-free. Even a season lacking in breadth will have a Durarara, a Madoka Magica, something for people to agree on. What we’re ultimately seeing with average rank is how much people liked the B-tier shows (more numerous, still solid, but appealing to fewer demographics), which is one way of looking at how deep a fandom goes.
To start off, let’s plot the average myanimelist show ranking by season. There’s a good chance that anything interesting will show up there.
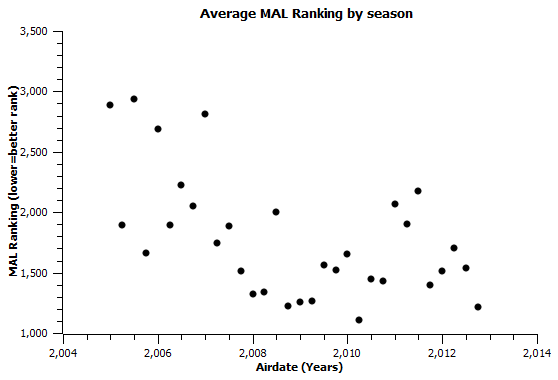
I admit I’m surprised by this graph. I expected it to be more cyclical by season, as Winter/Summer and Fall/Spring seasons represent 2 different amounts of shows produced. The fact that it doesn’t is interesting, as it suggests the average quality of anime in a season doesn’t depend heavily on how much of it there is. While there’s a lot of scatter, the graph is somewhat well-fitted by exponential decay.
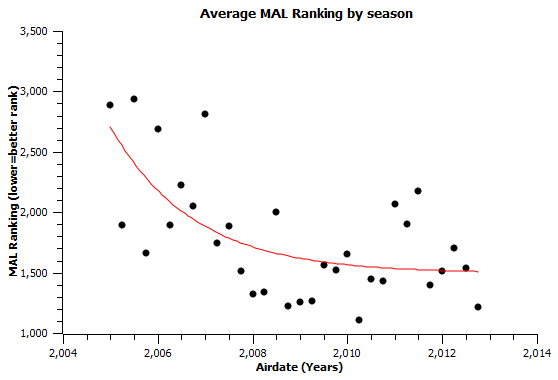
The exponential decay curve captures the general behavior of the increase in ranking over time, but there’s a couple of points (particularly 2009 and 2011) where it’s significantly off the mark. One possibility is that there’s a cyclical factor, fitted below.
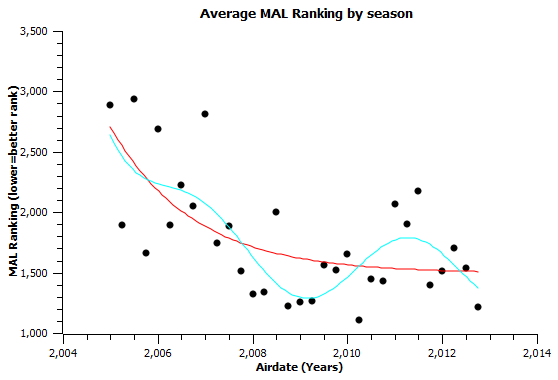
This sinusoidal fit has a period of about 4 years and a magnitude of about 250 ranks. It’s a pretty big difference in rank, and the cycle matches up pretty well with post 2007 data for every datapoint that isn’t Spring 2010. So we’re looking at a pretty possible case of hot-streak, cold-streak every other year.
Here’s the million-dollar question: does business (either Japanese or US) follow a similar pattern? We can check by fitting sinusoidal curves to their respective linear patterns.
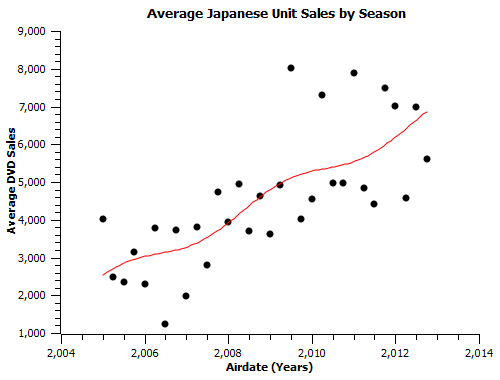
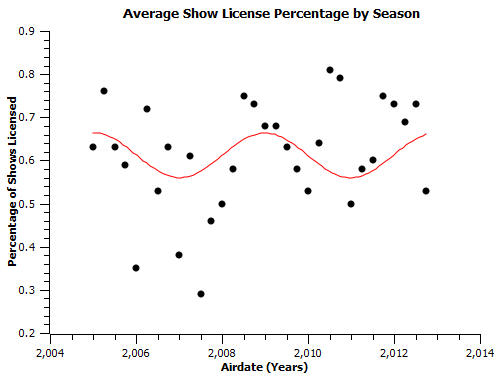
If there’s a cycle in average unit sales, it’s hidden behind other, more significant effects. English-speaking home video licenses, though? There’s a 4-year cycle there, albiet a weaker one than in the MAL rankings. This cycle peaks in 2009 and bottoms out in 2011, just like the high-low ranking cycle.
So what does this mean? Well, first of all, there is a predisposition for newer shows to be ranked higher, though ranking is also affected by a 4-year cycle (and *not* an on-off seasonal one). Second, the amount of stuff that gets licensed in the U.S. for a given season depends somewhat strongly on how highly ranked the average show is. Third, the cyclical nature of the English-speaking rankings means that there’s some regular pattern of when that fanbase gets really excited about anime. If that’s true and not just the industry being streaky, it means 2013 will show itself to be a great year. I can hope for that, at least.

I happened upon this post, which I missed before. That average unit per season chart seems like a good counterpoint to “anime is dying” threads that pops up once a while. Any chance you will update it with 2014 data, and illuminate for us whether 2014 was really as “off” as people supposed?
(I can understand if you want to wait for Fall data to come in.)
Unit-sales wise, it’s not necessary to wait for exact numbers because of how clear the trend is. You can compare it with 2012-2013 in the different years and see how different the means of various tiers of unit sales are:
2012 10k+: 25043 (12 total)
2012 5k-10k: 7611 (20 total)
2012 <5k: 2086 (74 total)
2013 10k+: 23067 (13 total, incl. Arpeggio)
2013 5k-10k: 7475 (19 total)
2013 <5k: 2109 (95 total)
Compare w/ 2014 currently:
2014 10k+: 20864 (9 total)
[incl. P4GA which will drop out, 22,156 over 8 shows w/o P4GA]
2014 5k-10k: 7141 (16 total)
2014 <5k: 1833 (97 total)
That 2014 10k total doesn't count UBW, but comparisons with Zero's stalker points peg it as likely to do around 20k, which would pretty much stick the average where it is while bumping the total up to 9 10k+ shows.
The means make it pretty obvious, I think, that the middle tier isn't populated with almost-10ks that people have, in various places, argued would indicate a market healthier than the 10k count made it look. It was a weak year at almost all levels of the disk-sales food chain, and LL s2 wasn't even a record-breaker with a 60k-ish average (though it didn't make all its money there). Still could be just a blip in the grand scheme, something that'll be more obvious 5 years down the road. I would say it was weak enough to be worth noting, especially given that the second-tier seemed to be having as tough of a time as the tippy-top 10k field.
With anime in particular, you can't have sequels without having something successful to continue. There were only 5 non-sequel 10ks (1 20k) in 2014, as opposed to 7 (3 20k) in both 2013 and 2012. That means fewer near-guaranteed 10k sequels 1 or 2 years down the road.
Published a piece in general looking at second-tier hits and how they're important to markets' long-term success. Might be worth a read, given all of the above: https://animetics.net/2014/07/30/fun-with-numbers-dragonball-naruto-love-live-and-the-importance-of-second-tier-hits/
From an MAL perspective (with a healthy dose of recency bias/sequel favoritism), the year didn’t really have a problem. 9 of the top 60 anime on myanimelist’s rankings are from 2014. 5 of them are even newly-adapted series:
Haikyuu
Ping Pong
NGNL
UBW
Kiseijuu
UBW: special
Mushishi special
Mushishi again
Mushishi a third time
Compare 2013’s 4 w/ 3 sequels:
Madoka Rebellion
S;G movie
HnI: Rising
Shingeki no Kyojin