The investigation into video game source popularity (started with 2011 data here) continues into 2012, where, despite an increase in the total number of shows aired, the number of game adaptations remained almost constant (rose from 9 to 10) and the total number of 10k+ shows actually went down (from 4 to 1).
To recap the meaning of these numbers; in order to get some idea of how existent and/or strong the video game franchise popularity -> anime popularity -> added video game franchise popularity chain is, I pulled a pair of stats for each of the 10 video game adaptation anime made in 2012 that I have data for. The 2 stats I chose to measure video game popularity were maximum yearly rank of the franchise on popular VN retailer getchu (mildly NSFW) and total console game sales for games released within one year of the anime’s initial airdate, via vgchartz. Data is archived here, and summarized on the chart below.
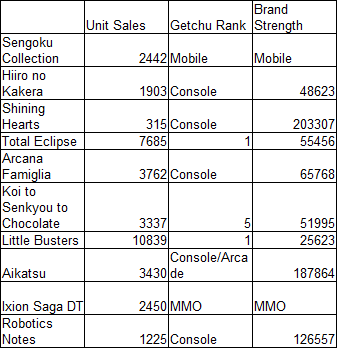 Notes on Individual Series:
-Ixion Saga and Sengoku Collection, based off of an MMORPG and a mobile game, respectively, lack publicly available statistics with which they might be judged. It might be more appropriate to group these two in with merchandise/spinoff based shows, as they share the common element of a definitive non-disk source of income that’s difficult to quantify (ie the functional meaning of that category). A similar caveat would apply to Aikatsu, which started off as an arcade CCG, but that the series also released a 3DS game soon after the anime which sold about 200,000 copies.
-Little Busters and Total Eclipse were the only two game adaptations to average over 6000 in disk sales. Both come from franchises that put a game at #1 on the getchu rankings at one point (MuvLuv in 2003, Little Busters in 2007). However, 2011’s MajiKoi (from a franchise that ranked first in 2008 and 2012) put up a much weaker performance (~3300 disk average) with a similar statistical profile.
-Shining Hearts, an adaptation of a game that sold about 200,000 copies and aired at a time when a sequel was selling equally well, did pretty horribly in the disk sales department. It didn’t produce any notable boost in franchise sales, either.
General Commentary:
In general, this inspection into video game source material has been less illuminating that I would have hoped. Within this sample, there’s no definitive pre-airing tell that indicates how an anime might perform, and it’s difficult to separate out new fans the anime may have added from old hardcore ones on most PSP releases (UtaPri from 2011 is the only slam-dunk example).
Really, it’s likely that some combination of malleable price points and relative quality of adaptations is in play here, and the two are hard to separate. At the least, there’s evidence that refutes most absolute arguments; Steins Gate rode a comparatively less popular PC game to huge success, Little Busters did the same with a very popular PC game, popular console game adaptations Im@s and P4 did extremely well, and Shining Hearts did extremely poorly with similarly popular source material. Given that there are so many strong counterexamples in a sample with only 19 total datapoints, I’d say the key takeaway is that source material popularity is a fairly weak indicator of disk sales success in games*, even if many of the franchises could potentially break even if they’re responsible for a sufficiently large share of game sales.
*One theory that games are harder to adapt, and adaptations themselves don’t sell unless the staff is putting in truly exceptional effort into making the adaptation a stand-alone, entertaining product. I like this one because it paints people in a positive light and because one of the overarching goals of this blog is to set the conversation about the importance of staff back by about 5 years.** It is, however, not the only possible explanation. The biggest alternative theory, I think, is the malleable price points one, where more of Im@s’ fans are the significant disposable income types more likely to splurge 30,000+ yen on anime.
**Because said conversation has spent the past 5 years advancing in a very fragmentary, eye-testy direction. Describing a director or writer’s resume in terms of straight good show/bad show terms might be even less informative than using win-loss records to rank pitchers in baseball. Source material definitely counts towards how impressive a success is, whether we’re talking about garnering hit sales or nigh-unanimous praise, as well as the talent level of the rest of a show’s staff. Allocating credit properly is hard, and involves a lot of factors; if a method for doing so is easy to use, it’s probably wrong.

Pingback: Fun With Numbers: Game Time (in Anime) | Animetics