An interview with Dynasty Warriors: Gundam 2 producer Hisashi Koinuma.
Via Anime Insider: Hisashi Koinuma (April 2009)
Reply
An interview with Dynasty Warriors: Gundam 2 producer Hisashi Koinuma.
Tomy’s Glen Stolz talks about the localization of the Naruto: Clash of Ninja series of video games.
Media Blasters’ Sean Molyneaux talks about the company’s decision to get involved in games.
Dragon Quest is a interesting franchise of games for a number of reasons: it’s got a very nationalized fandom (large in Japan, tiny worldwide), the cutest mascot, and it’s really damn good.* Of particular interest here is that the Dragon Quest franchise has, from very early on, incorporated a good deal of random chance. Owing to the creator’s personal interest in gambling, opportunities to press one’s luck are found throughout the franchise, both overtly advertised in casinos and more subtly worked in the battle system. Unlike in real life, the casinos in Dragon Quest are eminently beatable – save at church, play highest-stakes game available, reloading if necessary, until a win happens, and repeat until you have the Metal King Sword at level 8. The finer points of DQ’s battle system are less obviously solvable – information beyond one’s control can determine whether a risk one is about to take is smart or stupid, and a lot of fictional parties ended up dead thanks to their players inadequate assessment of said risks.
One of the most fun choices in the series originates from a spell introduced in the series’ third installment. Zing is a spell which, half of the time it is cast, does nothing, an annoying feature balanced out by what it does the other half of the time – resurrect an unconscious party member. Thus, for much of the game, a player with a KO’ed ally faces a nonsimple dilemma – is zing generally worth it? Does the upside of having that ally back outweigh the opportunity cost? I’m going to examine some of the fundamentals of that question using a fairly basic battle simulator I built from scratch.
US VA Quinton Flynn talks about doing voice work for Metal Gear Solid.
There’s been plenty of talk, both here and elsewhere, about the difficulty of adapting games and/or how often game adaptations go bad. One of the most oft-cited problems with anime-game adaptations is the pacing, or more specifically how rushed many game adaptations feel. Well, while pacing is a complicated question and slower/faster does not necessarily equal better, we can quantify a basic part of that phenomenon; does a particularly low ratio of anime runtime to game playtime adversely affect the series’ sales?
First, though, it would help to know; what is a typical ratio of anime runtime to game playtime? Between gamefaqs (user-submitted averages) and vndb (ranges of playtimes), I was able to put together a fairly complete list of approximate hours taken to complete the 16 VN and console games adapted into anime in 2011 and 2012 (chosen because I’ve already done some research on those and had them available). I then compared that value for each show to the number of hours (assuming ~20 minutes per episode) allotted to its anime adaptation. For these 16 games, there was an average of 0.13±0.05 minutes of anime for every minute of game playtime, and most series fell within that range (the lowest ratio was Hoshizora e Kakaru Hashi’s 0.04, the highest was Hiiro no Kakera’s 0.21). Turns out, there was a pretty interesting (though it is perhaps just a product of small sample size) relation which fell out of plotting the ratios against another well-known quantity – disk sales averages:
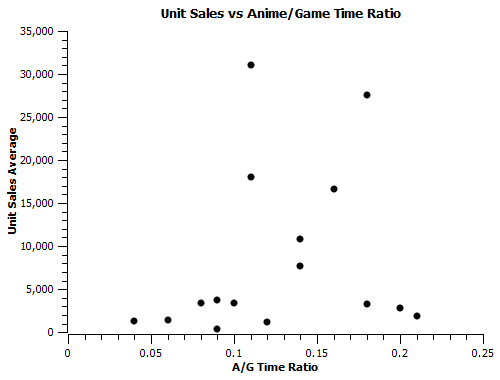 Specifically, it seems that, while there is a lot of variance for any given range of A/G time ratio, there are no 10k+ hits with a ratio lower than 0.1. The sample is small enough that I don’t want to say too much about this at the moment, but if this holds up in other years, it could be a definite point in favor of the argument that game adaptations that face extremely uphill battle in squeezing in content are more likely to fail (or less likely to hit) than those with a little more leeway in terms of allotted airtime.
The investigation into video game source popularity (started with 2011 data here) continues into 2012, where, despite an increase in the total number of shows aired, the number of game adaptations remained almost constant (rose from 9 to 10) and the total number of 10k+ shows actually went down (from 4 to 1).
To recap the meaning of these numbers; in order to get some idea of how existent and/or strong the video game franchise popularity -> anime popularity -> added video game franchise popularity chain is, I pulled a pair of stats for each of the 10 video game adaptation anime made in 2012 that I have data for. The 2 stats I chose to measure video game popularity were maximum yearly rank of the franchise on popular VN retailer getchu (mildly NSFW) and total console game sales for games released within one year of the anime’s initial airdate, via vgchartz. Data is archived here, and summarized on the chart below.
I may have mentioned this before, but nailing down the impact of anime on video games (released on irregular timetables and with less baseline-dependent variance in stats) is much harder than ballparking the same effect for manga or light novels (where volumes are released at regular intervals and can generally be seen to follow a pattern in the absence of strong outside stimuli). Too, while sales tools exist for measuring the success of console video games in Japan, those tools are much less viable when it comes to measuring the effects of typically PC-based visual novels. Still, roughly 10 anime are adapted from games every year, and it’s a very important part of the market to understand.
In order to get some idea of how existent and/or strong the video game franchise popularity -> anime popularity -> added video game franchise popularity chain is, I pulled a pair of stats for each of the 9 video game adaptation anime made in 2011 that I have data for. The 2 stats I chose to measure video game popularity were maximum yearly rank of the franchise on popular VN retailer getchu (mildly NSFW) and total console game sales for games released within one year of the anime’s initial airdate, via vgchartz. While it should be noted that this was a small sample taken in a year with slightly fewer new shows, the results are potent fuel for speculation. Data is archived here, and summarized on the chart below.
After finishing up an individual analysis of manga and light novel adaptation markets, I had originally planned to toss the remainder of shows not covered in those analyses in one bin and call them “other”. It took about 5 minutes into assembling that sample to realize how incomplete that analysis would have been. There are at least 3 additional distinct categories that anime adaptations fall into: Game Adaptations, Spinoff/Franchise/Merchandise Series based around a larger product line, and True Originals.
Why games should be treated beyond simple disk sales is pretty obvious, but here’s one example. Persona 4: The Golden, released several months after the end of the anime and before the true final episode, sold a reported 248,242 copies in 2012 at an MSRP of over 7000 yen. If its anime was spending 10,000,000 yen per episode, on the low end of what’s been reported to be typical, then the total anime budget was on the order of (10000000*26)/(248242*7000)=.15, or fifteen percent of gross profits from those sales.* So Persona 4 only really needed to bump the game’s sales total up by about 10-20 percent to be worth it before even counting the 30k+ average it posted. Now, the Persona 4 anime hardly needed that money, but this does underscore that for anime series like, say, Starry Sky or Mashiroiro Symphony, being coupled to a PSP re-release of their source title is a pretty potentially big deal. I’ll be using vgchartz or something over the next several weeks to determine just how much, but it’s definitely something that needs to be looked at along with disk sales in determining how successful titles at all tiers of sales were.
The reason why spinoffs and original anime are not lumped together is a bit more nuanced. Though the distinction between the two is a tad fuzzy, the notion that truly original anime have stronger marketing pushes behind them that may prompt better disk sales is worth strong consideration. Not to mention that there’s at least some element of merchandise (however unquantifiable) being marketed beyond the disks. All of the 10k+ series in the non-Game/Manga/LN heap are true originals, so there may be more to that idea than a pipe dream. I can tell you right now that the list of originals makes for a fairly stacked chart; including things whose main goals were TV ratings (noitaminA, Phi Brain) and excluding Madoka Magica, the average original TV anime in this period sold over 8000 disks per volume.
