Fun With Numbers: Anime as Light Novel Advertisments in 2012

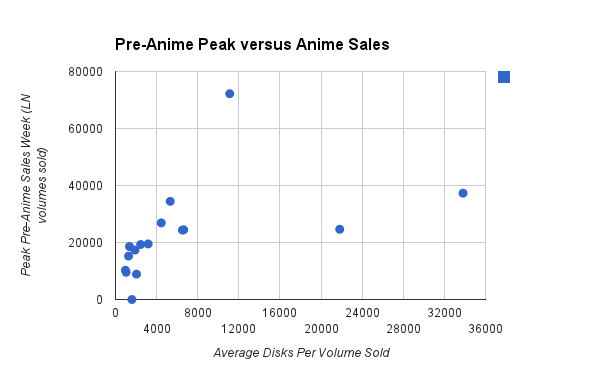
Compared to 2011, 2012 represents an upswing year for the industry; more overall TV anime was being made. In addition to simply seeing more light novel adaptations, we saw several adaptations of finished series (Kotenbu/Hyouka and Chuu2koi) and single novels (Another, Shinsekai Yori). Those four are notable, but not within the LN data I’ve been using for my sample.* Perhaps because of the minor resurgence in the industry, we do see a bit of an increase in the number of series that performed in unexpected ways. The performance of light novels which were adapted in 2012 in relation to the time frame their adaptation aired is charted below. The raw data is on this doc, and can be compared with the 2012 sample for manga.

Continue reading

Fun With Numbers: Anime as Light Novel Advertisments in 2011

Despite the fact that both get released in compiled volumes costing somewhere between 400 and 1000 yen a few times a year, the market for manga differs in many ways from the market for light novels. For one thing, it’s a much smaller scale market; the most popular light novels sell hundreds of thousands of copies immediately after their release, rather the millions that One Piece/Fairy Tail/Attack on Titan bring in. Too, light novel adaptations tend to succeed much more as a function of their initial popularity than manga does. To get an in-depth look at how anime adaptations of light novels have impacted the source material, I’ve plotted the sales for their first two weeks of solicitation over time, with the airdate of the anime superimposed. See this doc for the raw data, and compare the 2011 data for manga adaptations.

Note: I plot the two-week totals, rather than the one-week total, because even the average the first week total is vulnerable to a series that comes out on the last of the Oricon tracking period and having its sales numbers hamstrung. Kore wa Zombie Desu Ka had 4 volumes in a row come out on the last day of the week, obscuring a very real anime-fueled boost in sales.

Continue reading

Fun With Numbers: The Bimodal Nature of Light Novel Adaptations in 2011

The sales levels of anime adaptated from manga are basically a crapshoot. Not so much Light Novels. Though I still haven’t compiled at the 2012 data, but one particular bit of information popped out of the 2011 sample that it deserves its own individual mention. It’s best described as 2 rules of thumb:

1. No LN series that had at least one week where a volume sold 20,000 copies in that week (disregarding cumulative totals) that went on to sell less than 4000 disks per volume. Only one (Mayo Chiki) sold less than 5000.

2. No LN series without at least one week where a volume sold 20,000 copies sold more than 4000 disks per volume. Only one (Kore wa Zombie Desu Ka?) sold over 3000.

LN_Peaks

Continue reading

Weekly Light Novel Sales Data for 2013

Weekly Oricon rankings of Light Novels, continued from the 2012 post. Based on just what I saw copy-pasting these lists together, there’s a pretty favorable case to be made that Mahouka Kouko no Rettousai will sell more than anything else in 2014. More on that when I actually get around to using these for the purpose I compiled them for.

Continue reading

Weekly Light Novel Sales Data for 2011

Weekly LN rankings from 2011, continued from the 2010 post. This is where the sample starts getting interesting for the purpose of determining the effects of LN sales on the popularity of an anime (and subsequent effects of the anime’s popularity on LN sales), since we have a solid baseline or thresholds for comparison from previous years for everything that got an adaptation this year.

Continue reading

Weekly Light Novel Sales Data for 2010

Same as for 2009, but for 2010. This year sees multiple series (BakaTest, Durarara, and OreImo) scoring huge sales resurgences soon after their anime aired, taking up 5+ spaces on the weekly charts with old volumes. It helps to have a chart threshold that’s below 10k. This phenomenon also happens on the manga charts, but far less frequently and to a much lesser degree for series not named Blue Exorcist or Attack on Titan.

Oh, and a quick fyi; the reason why there are different list sizes for different weeks is because these are taken from the LNs that charted on the overall novel rankings, and their numbers can vary by week.

Continue reading

Weekly Light Novel Sales Data for 2009 (April-December)

I noted in my 2014 “questions” post that I wanted to do a breakdown of Light Novel sales as compared to the reception of anime adaptations. I also noted that myanimelist kept the data, but in weekly posts that were archived on myanimelist’s news forum, a place so organized that 2009 threads will often be bumped up to 2011, with a search function that only displays a max of 30 or so posts and adds about 20 seconds to the collection of every datapoint by pointing you to the last post made in each thread. This is no fault of dtshyk,  Snowical, and symbv, the mal news people who have done a straight up excellent job of keeping LN (and manga) data on a weekly basis for nearly 5 years now. Many thanks to them for keeping the data archived in a retrievable and easy to understand format.

Since I don’t have much else in terms of data to crunch until February ends, I decided to see what I could do with that. After taking down data for 3 of the 16 series in my 2011 sample, I realized that individually going through the forums and looking for the release weeks was inefficient as all get out, so I decided to just make a master text file for each year’s worth of data and wash my hands of people bumping a post 2 years into the future to point out how happy they were that Katekyoshi Hitman Reborn was on the manga list. I figured it wouldn’t hurt to make these collections available as I finish them. As far as I’ve searched, there’s no other English-language site that archives these data in a convenient format. And if there is, well, redundancy is always nice.

Continue reading