Fun With Numbers: Incomplete Collection

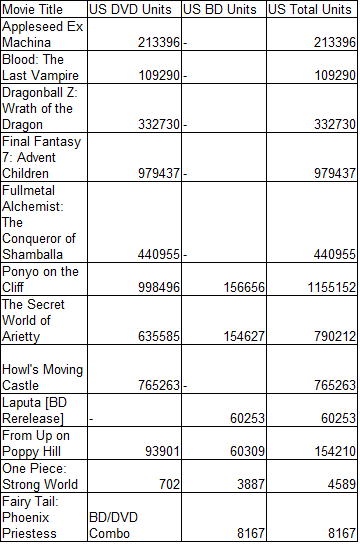
I spent this morning putting together US amazon release data for September. It’s shaping up to be an interesting months in a while – at the least, series that haven’t provided any DVD/BD chart datapoints yet are in the mid-to-low 4 digits, suggesting some of them could possibly chart, yielding more data that would make estimating sales via amazon more feasible. That’s a lot of fun, and I wish I could be more excited about that, but getting together the data reminded me of something I’d much rather forget; Sentai Filmworks’ Gatchaman Crowds release. It’s labeled on amazon as the ‘Complete’ Collection, which is a label it takes tremendous balls to stick with when your release knowingly excludes the actual last episode of the series. The official reason why the Sentai version of Crowds will be excluding the episode is that it is owned by some entity separate from the original licensee, was given in a answer which was (probably intentionally) vague about exactly what happened in regards to the episode. What is not vague at all is the fact that the R1 release of this series will be lacking critical content as the home video equivalent of a 500-page novel with the last 20 pages ripped out.

Personally, I’m perfectly okay with companies that play to win. Anime is a niche market, and people at every level have to make hard choices in dealing with the business side of the industry. I’d rather an industry stay sustainable and churn out products I really like than break the bank over artistic integrity and end up unable to churn out any kind of work in the future. That statement represents a significant oversimplification – entertainment being a business doesn’t force a binary choice between sales and artistic integrity – but my point here is that choices made with finance in mind aren’t necessarily evil ones. There is a wrinkle to this particular story, though, that rubs me the wrong way.

Continue reading

Fun With Numbers: September 2014 US Amazon Data (Initial Numbers)

August was a boring month as far as high-powered releases go. September is not, and there are a couple of series (particularly the Steins Gate combo pack hovering around 1500 with 4 weeks to go and the second half of Attack on Titan) which figure to have a pretty decent chance of making the US BD charts and providing really useful data. 4 solid datapoints wouldn’t be much, but it’s a lot better than 2. I could get more pumped about that if one of the release titles due out this month weren’t straight-up false advertising.

Continue reading

Fun With Numbers: Attack on Titan’s US Release Sold 11,748 Copies on Week 1

OpusData BD data for the week ending in June 8th is now publicly avaialble, and since the BD/DVD combo packs are counted as BD releases (as they were for the Fairy Tail movie), that means we have sales figures for Attack on Titan’s part 1 release. The release, which performed the best on amazon out of any US release I’ve tracked in the past 6 months. Assuming the BD/DVD combo packs were counted the same way this company has previously done, Attack on Titan was the 14th best release among US BD content on this week, selling 11,748 copies.

AoT_wk1_us

This actually represents a severe underestimation for my rough-fit model, which pegged it at around 30,000 copies. While it underestimated DBZ season 3’s first week by 20%, this represents an overestimate of more than 60%. It’s possible that the series’ airing on network TV during solicitation made it more of an amazon-heavy title. Most likely, though, this underscores the fact that the model is still rough and prone to error. I’ll be tweaking the model a bit in the next couple of days to see if I can get a model that less severely overestimates this series while still covering the other two points of confirmed data (DBZ s3 and Aria the Natural). I should have at least one more chance to test that model when the series’ second part comes out in late September.

Fun With Numbers: A Good Summer for Hot Cocoa

This past week was a pretty unambiguously good one for Square Enix’s publishing division, featuring sales of over 95,000 for previously-unranked Isshukan Friends, a boost for the old volumes of Gekkan Shojo Nozaki-kun, and the final volume of Cocoa Fujiwara’s Inu x Boku SS topping the list with over 250,000 copies sold. That last part might not even be the most impressive thing Fujiwara did this week, either. While the 250,000 in IxB sales is, in large part, in keeping with previous volumes of the series, Fujiwara also saw her brand new manga, Katsute Mahou Shoujo to Aku wa Tekitai shite Ita, notch first week sales of over 80,000. While not unprecedented by any means, that level of early sales puts her on a pretty exclusive list.

Continue reading

Fun With Numbers: Dragonball, Naruto, Love Live, and the Importance of Second-Tier Hits

Weekly Shonen Jump is Japan’s most successful manga magazine, something that’s been true, excluding a brief early-aughts blip, for upwards of 20 years. But the brand didn’t get there by some fluke – it earned notability by harnessing a number of talented artists in many eras; Go Nagai in the late 60s, Buichi Terasawa and Osamu Akimoto in the 70s, Hirohiko Araki, Masami Kurumada, and countless others in the 80s.

But that doesn’t mean the past 2 decades were free of uncertainty or bad luck for Shueisha. In actuality, in between the early-nineties peak where the magazine’s circulation topped 6 million copies and the modern era of Oda Eiichiro breaking his own volumes’ records on a regular basis, they experienced one of the biggest misfortunes that can befall a publishing empire: two franchise cornerstone series ending withing 13 months of each other.

Continue reading

Fun With Numbers: August 2014 US Amazon Data (Initial Numbers)

July’s almost over, and while I’m not totally done tracking releases for that month, I think it’s reasonably safe to say none of them are likely to snag an elusive top 20 BD/top 30 DVD slot – Naruto and Hetalia were the only series to spend multiple days in triple digits and neither cracked the top 500.

This August looks pretty thin in terms of series likely to chart: the only releases currently better than 20,000th are DBZ’s sixth BD set, Love Lab, and Shinsekai Yori’s second half. Tracking them, as always, to add to the dataset and hopefully eventually enable analysis of the US market.

Continue reading

Fun With Numbers: Short-Term Versus Long-Term MAL Rankings

Continuing on from my previous post on the notable changes of series popularity over time, I did some similar work on rankings. The shows analyzed are the same (all those tracked in fantasy anime league from Spring and Fall of 2012 and 2013), only this time I’m looking at the evolution of rankings; how series swap places in the rankings over time and which ones rise and fall most significantly. The data used this time around can be found here.

Continue reading

Fun With Numbers: Short-Term Versus Long-Term MAL Popularity

Back in late April, I was taking a look at some available numbers which may indicated casual interest in a show, including myanimelist statistics, for the disk sales and print bumps of series aired in the latter half of 2013. In order to get the mal values, I pulled them from the site a couple of days before I posted the relevant articles. One of the comments on this article raised a very legitimate question; how did I know that these values were consistent with the ones a series had in midseason, around the time we would hope to use them to predict print boosts and disk sales before they happened. That was a key assumption – that series’ relative popularity and ratings would remain constant after the end of the season. This turns out to be a bit of an oversimplification, especially for older seasons of anime where things have had more time to change.

Using fantasy anime league data, I was able to go back and look at both the popularity and ratings a show had at the end of a season (i.e. prior to the beginning of the next season). Many seasons of data are available, but I have chosen to focus on 4: Fall 2013, Spring 2013, Fall 2012, and Spring 2012. Note that Summer/Winter seasons are not tracked by fal. This post focuses on my analysis of the evolution of the popularity numbers (collected here) as compared with values taken in late July, 2014. Namely, I want to know if series exhibit significant postseason changes relative to their peers and, if so, which series do so most prominently. I’m still playing with ratings data, and will address those in a separate post later.

Note that Kyoukai no Kanata and Kill La Kill were excluded from the Fall 2013 fal season for understandable competitive balance reasons. Their exclusion is nonetheless somewhat frustrating, as they would have been interesting to look at through this context.

Continue reading

Fun With Numbers: The Non-Cancellation of Popular Manga Post-Anime

One of the most fundamental issues I take with English-language discussion of anime is the degree to which many people simply ignore manga outright. From a demographic perspective, this makes sense; Japan spends roughly 5 billion dollars on manga every year, and in France, the annual income in dollars of the manga industry (~125 million) exceeds the number of people living in the country (~66 million), but the average United States citizen spends about 38 cents per year (120 million per year market, 318 million people) on manga while pirating or illegally streaming approximately 6 gazillion episodes of anime. Ok, I made that last figure up, but I did plug in the 2 sites that “free streaming anime episodes” pulled up for me on google into a web value calculator, and those sites, gogoanime and kissanime, have a combined estimated pageview total of 1.5 billion per year, and they’re hardly the only ones out there that do what they do.*

It’s worth noting that I’m not at all unbiased about this; manga is kind my favorite thing. And that’s why I fall into the devil’s advocate role when people try to build anime-centric narratives surrounding manga. One of the most common permutations of this phenomenon pops up when a manga series ends soon after an anime adaptation of it. I’ve seen it argued in different places that poor anime performances killed off C3-bu, Daily Lives of High School Boys, and Binbougami ga. The most oft-cited piece of evidence in these cases is the timing of the ending of the series; if the franchise became more popular, it wouldn’t make sense to end it in the middle of that boom. The issue with that line of reasoning, though, is that authors can and have quit on extremely popular series at multiple times in the past. Inoue Takehiko ended 100,000,000+ seller Slam Dunk in the middle of a major tournament, and Hiroyuki Takei ended Shaman King early for health reasons. At the very least, author burnout is an alternate hypothesis that needs to be addressed, either with additional evidence for the “cancelled” argument or a direct quote from the author. Since the latter is only available on a case-by-case basis, I’ll be taking a look at the first question; does a lack of a visible sales boost increase the odds that a manga will end a year or so after the anime adaptation?

Continue reading

Fun With Numbers: Various US Anime Movie Disk Sales Totals

I recently made a trial account on opusdata to see what I could scrounge up as far as anime data goes. Unfortunately, I wasn’t able to get a ton of data, since the backlog of weekly charts are anything but free. But I did come away with their sales figures for a couple different anime movies, whose sales ranged from over a million to a couple thousand depending on how mainstream the title was:

anime_movies-us_salesThe One Piece/Fairy Tail movie numbers may or may not be reflective of what the shows regularly put up. I have a couple volumes’ worth of data for each, and plan on estimating what their long-term sales are after I get additional confirmation of the amazon model I’m currently using. It does seem, based on a cursory glance at the current rankings of March/April releases, like US releases have fairly long tails.