Fun With Numbers: Myanimelist Stats Predicting the Fall 2013 Disk Over/Unders

Edit: Link to source document fixed.

Like those of any other free-access site, or any one set of numbers, statistics from myanimelist should be utilized with caution. But that doesn’t mean they shouldn’t or can’t be used. In this article, I’m looking the current rank and popularity of 38 shows from the Fall 2013 on myanimelist to determine how they stack up against other methods of doing the same. As before, note that any accuracy below the best null hypothesis of .66 is fairly insignificant.

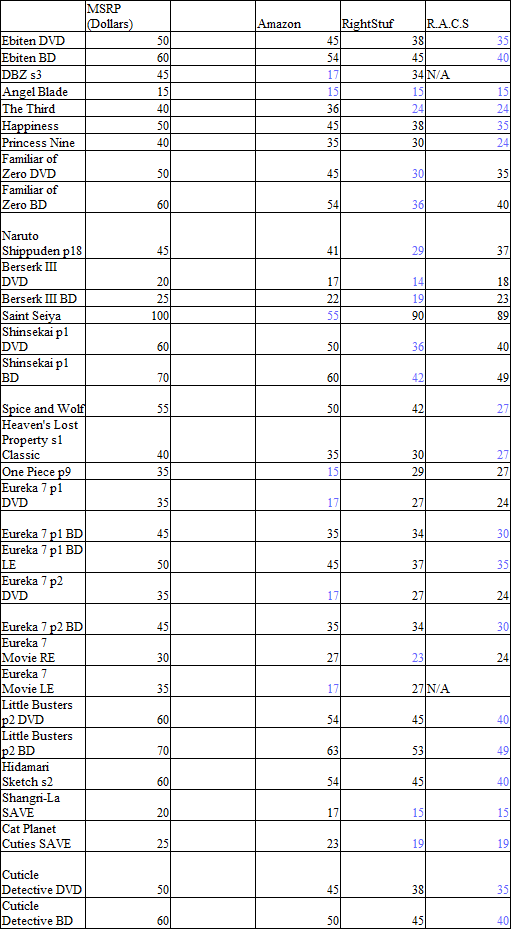
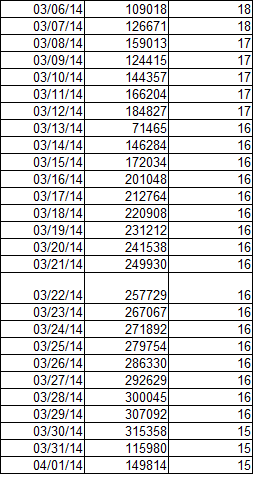
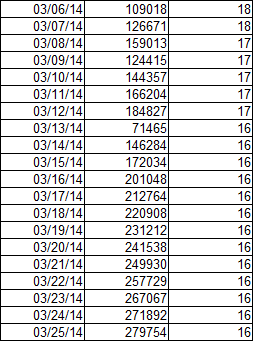
By the by, the myanimelist stats used in this piece were taken in late April, 2014. Odds are they’ve changed a bit since the outset of the season, though shifts within the season tend not to be particularly cataclysmic. Most can probably be viewed as in a similar boat to December Torne/eps 9-12 Nico ranks, in that they’re made when the audience has more information about the show (i.e. has seen more episodes). I used both rank/score and popularity/total number of users to order the shows, and then checked how many v1 sales using the top 5/10/15 shows on those lists correctly pegs as over or under 4000 disks. Data can be found on this doc, and the results are below (indicators greater than the null hypothesis in green):

mal-comp
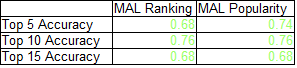
Turns out, both indicators do about the same, both beating out the null hypothesis for all 3 list sizes. Out of the metrics I’ve examined so far, that’s the best overall performance. Of course, keep in mind that this is a fairly small sample, and there are other ways (notably source material sales) that these indicators may be telling. It’s still fairly early in the project to say much, beyond the fact that mal stats are at least a little more indicative than random chance.

Fun With Numbers: Nico Stream Rankings Predicting Fall 2013 Disk Over/Unders

Niconico stream rankings are one of the most frequently talked-about stats when it comes to early-season indicators of how a show might be performing. It’s been somewhat frustrating to me that they seem to get brought up at the beginning of every season, but how accurate their predictions were has never really been revisited. By comparing their basic effectiveness with the eventual disk sales results, hopefully we can get a little more context for how those numbers should be interpreted.

Nico ranks come with a couple of numbers attached, so I’m looking a couple of them to see which ones worked best. I use 3 metrics: the number of viewers at the end of the episode stream, the percentage of viewers who gave the episode a 1 (the max score), and the product of those first two (i.e. the number of users who gave the episode a max score). All 3 of these metrics were averaged over episodes 1-4 (October), episodes 5-8 (November), and episodes 9-10,11, 12, 13 (December). I then determined how accurate guesses based solely on these method would be if the top 5, 10, and 15 items on the list were assumed to have their first volume sell over 4k disks.

It should be noted that only 25 of the 38 Fall shows I’m using v1 data for have available Nico rank data, 9 of which had v1s sell over 4000 disks. In the interest of not polluting the sample, I’m just checking the accuracy of the rankings within the sample, excluding the other 13. This does leave the sample with a different over/under ratio than the full seasonal sample (36% instead of 34%).

Anyway, here’s how the various methods performed on the Fall data (detailed data here, breakdown doc here). Numbers for the ones that beat the .66 accuracy afforded by the best null hypothesis are shown in green:

nicoran-compTotal number of viewers arguably performed the best, besting the null hypothesis outright in October and December. Max rating % did very well when only taking the top 5, but fairly poorly otherwise (the top 15 models barely beat out a coin flip model). Max rating number was fairly spotty, except as a broad-strokes indicator in October and a top-tier indicator in December.

This is data taken from a fairly small sample, but these numbers do suggest that the top-tier of the rankings and the total # of stream viewers are at least better than random chance at picking which shows will succeed, something that couldn’t be said for most Torne DVR lists. How impressive that is depends on how well other indicators do and how well it holds up to an extension of the sample size.

Fun With Numbers: Torne DVR Rankings Predicting Fall 2013 Disk Over/Unders

Note: The original version of this article incorrectly stated that there were 39 shows in the Autumn list, not 38. This has been corrected.

This is the first proper article in what will hopefully be a few individual examinations of the power of various indicators to predict disk sales in a rough manner. This segment deals with Torne rankings, a list ranking shows based on how often they were recorded on PS3 DVR. The original data can be found here, and is collected on this doc. I’m comparing these ranks with the rank of v1 disk sales to see how predictive the former were of the latter, based on an over/under 4000 accuracy model.

See this post for details, but basically, one can get 66% accuracy just by predicting that every v1 will sell under 4000 disks (25 of 38 shows in the season were under). Hopefully, good models will do better than that. In order to test how well each metric performs, I take the top 5, 10, and 15 seasonal shows from the metric and guess they will be over 4000 while everything else will flop, then see how many of those “guesses” end up being right. Clerical note: I’m excluding shows from different seasons (eg Monogatari, HxH) that end up in the Torne rankings, and my top 15 shows are the top 15 to rank from Fall 2013 only.

Since Torne rankings are available monthly, I also compared the accuracy of different months; one might expect later months to be closer to the final sales total, as people have had more time and information (read: episodes of the show) with which to make an informed decision. Assuming the metrics are indicative at all, of course.

Anyway, here’s how accurate the top 5/10/15 guess models were for October/November/December Torne Rankings (numbers outperforming the null hypothesis in green):

torne-correctedThe top 15 model doesn’t seem to be particularly precise in general, but accuracy improved each month, and the December rankings were actually notably accurate. We’ll see how these indicators stack up against others (and how well they compare with source boosts) later.


Fun With Numbers: Null Hypotheses Predicting Fall 2013 Anime Sales

Note: The original version of this article incorrectly stated that there were 39 shows in the Autumn list, not 38. This has been corrected.

There’s a lot of gray area that can surround the performance of shows early on in a season, before hard stalker numbers roll in and make prior predictions fairly irrelevant with their impressive model. I’m interested in what some of these early and less-rigorous numbers can mean, both for disk sales and lower-cost indicators, and I’m slowly putting together a list of them for Fall 2013 to test against how the first volumes of disks actually sold, along with how big a sales boosts related print media got.* This post deals with very little of those, just outlines three dummy models against which all other indicators will be judged when I get around to it.

The first criterion for a bit of data having any real meaning is its ability to do better than guessing that is either random or very dumb, outperforming what is traditionally known as the null hypothesis. Let’s say you knew roughly what the anime market looked like in 2013, and were trying to build a model to try and guess how the 38 shows to on that list linked above would do. Let’s say you’re just interested in whether a show will sell more or less than 4000 copies, and you judge the success of your model by how well it’s able to peg which shows go over and which shows go under. For reference, 13 of the 38 had their first volume sell over 4000, so the “actual” over odds are about ~34%.**

Continue reading

Fun With Numbers: The West-Side All Stars

Something I stumbled onto a while a go that made me curious was a seemingly non-trivial connection between myanimelist popularity in the sales boosts of both novels and manga attached to a given anime, which led me to some speculation as to how different Western and Japanese fanbases’ preferences really are.

This time, I’m taking a look at a similar question; how many shows with high levels of Western popularity truly bomb in Japan? To answer this, I took the TV shows in the top 200 most popular on myanimelist, and excluded the ones attached to any series that averaged over 4000 in disk sales, or had a novel or manga chart in its first two release weeks at 20,000 copies or more. What remains is, theoretically, a list of the series which failed to catch on in Japan despite catching on in the West.* Data via myanimelist, someanithing, and the Japanese BD/DVD sales wiki. Note that I count the box releases as part of the disk average for pre-millenial series.

Continue reading

Fun With Numbers: Pays to Shop Around

In my post-March piece on US amazon rankings, I noted there were other retailers that sold anime over the internet. I figured it was an important enough point that I took a look at the prices offered for the releases I’m tracking in April. Specifically, I took the MSRP for each of these 32 releases, and compared it to the actual prices offered at Amazon, Right Stuf, and Robert’s Anime Corner Store. Even a look limited to these three stores shows a pretty significant variation in which one offers the lowest price and how much (prices are in dollars and rounded up, lowest price in blue):

April-pricesNo one store has the consistent lowest price title sowed up. RACS seems to have be the bargain more of the time, and the amazon releases that are lower than the competition are much lower, but the relative price being offered really seems to depend on each release. Beyond helping me tweak my model and expectations for what US amazon can and can not be used for,* this list makes the millionth version of this point; if you’re going to shop for R1 releases, shop around.

*The rankings could still potentially be very indicative of the relative strength of similarly priced series, as stuff like shipping and service can cause people to prefer certain retailers. It comes down to whether amazon popularity is indicative of popularity elsewhere or not. Either way, it’s probably smart to expect Sentai releases with their lowest prices offered elsewhere to be underestimated by an amazon-only model.

Fun With Numbers: Statlines for the Video Game-Anime Adaptations of 2012

The investigation into video game source popularity (started with 2011 data here) continues into 2012, where, despite an increase in the total number of shows aired, the number of game adaptations remained almost constant (rose from 9 to 10) and the total number of 10k+ shows actually went down (from 4 to 1).

To recap the meaning of these numbers; in order to get some idea of how existent and/or strong the video game franchise popularity -> anime popularity -> added video game franchise popularity chain is, I pulled a pair of stats for each of the 10 video game adaptation anime made in 2012 that I have data for. The 2 stats I chose to measure video game popularity were maximum yearly rank of the franchise on popular VN retailer getchu (mildly NSFW) and total console game sales for games released within one year of the anime’s initial airdate, via vgchartz. Data is archived here, and summarized on the chart below.

Continue reading

Fun With Numbers: March Amazon Data and Ambiguity

Having 2-3 times as many datapoints does usually make things more clear, except when it doesn’t. Adding March releases to the set of amazon rank data I’ve been gathering did help fill out some of the plots, but it also brought me face-to-face with some very real points I overlooked last time around. At any rate, it’s been an informative month of data gathering (table’s here, if you’re interested). This post is mainly an update on where I stand right now on this cf of an analysis project, with a recap of points addressed last month, a summary of the other things that came up, and an *extremely* rudimentary sales estimation model.

Continue reading

Fun With Numbers: Amazon Rank Progression for US Releases (March 25)

Note: The part 3 of the series on composers is on hold for a little bit. I got pretty deep into the rabbit hole and want to actually listen to the stuff these guys wrote to see if their big pieces have common elements. Since music is more passive listening, it’s somewhat feasible, and is an important part of looking at what that junk stat means, if anything.

And speaking of articles delayed way longer than I expected them to be, game adaptations! While console game sales are somewhat reliably available via the numbers, PC VN data is not, so they can’t be reduced into a plottable stat in the same way that manga and LNs can (the latter’s data are still incomplete due to thresholds and long tails, but big gains are usually obvious because of there’s a baseline to compare them to). I eventually decided to start breaking them down as a two-number stat line; highest yearly rank on VN retailer getchu and console sales via vgchartz, both within one year on either side of the anime airdate. I hope that I’ll be able to start posting those 2011/2012 stat lines before Scottie Wilbekin wins me real money in my March Madness pool, both of which I have now successfully jinxed. Anyway.

This is the last individual/plot post I’ll be doing for the March US releases I’ve been tracking. The full sheet of data is available here. I’m doing tracking for several April releases as well, and will continue to do so so long as there look to be more questions worth the daily effort of collecting the figures. An analysis post, comparing some of the narratives I touched on earlier with the new data, discussing other points to attack with a sample that will continue to grow, and making very, very tentative factor-of-two sales estimates based on extrapolation from somewhat known low-end and high-end daily totals will (hopefully) be up sometime this week. Speaking of the low-end, here’s the last chart for the performance of that Aria the Natural release:

Aria-wk4Chart is date, rank, # in stock

Thankfully, I got the sale I needed this week. It seems like a single sale is enough to bump an item ranked 300,000th down under the 120,000th place no-sales line. Good to know.

Plots are posted after the jump.

Continue reading

Fun With Numbers: Amazon Rank Progression for US Releases (March 18)

Compared to last and next week, this slate of releases was a bit small, containing 3 rereleases (Zombie, Shana, To Love) along with 2 new releases (Upotte, Bleach set 20).

As before, here’s the rankings up to this week in Aria the Natural part 2, featuring one total copy sold and the majority of days spent ranked 120,000th or higher:

Aria-wk3

Chart is date, rank, # in stock

The decline in rank seemed to slow down this past week. I would guess that, once you get to the 200,000s, you hit a point where there are a lot more shows that haven’t sold in a while or at all, leading to a slower advancement. At this point, I’m mainly following the ranks to see if the series can drop back into the 70,000-80,000 range with the next purchase that gets made, or if the long drought will have significant effects on the post-purchase rank.

Plots are posted after the jump.

Continue reading