Fun With Numbers: Print Sales Bumps and Poking at the Demand Curve

It’s fairly common for manga or light novels getting an anime adaptation to receive some sort of boost in sales after the anime airs. However, both the presence or size of those bumps varies widely. These bumps represent an interesting opportunity for study, since they represent (potentially) an alternative indicator of both the financial impact of anime, as well as a look at the broader-scale demand curve for franchise-related goods. Not everybody can or will easily pay 30,000 yen for a full special-feature-laden set of disks, but such casual fans could still have a big impact on a series if the manga is within their price range.

The real fascinating part of this, though, is that casual fans need not support at all. While one almost certainly has to watch a show to be willing to buy the disks or even the manga, the reverse need not apply. The fact that the relation between disk averages and print boosts is so fragmentary implies a potentially similar disconnect between print bumps and total interest generated by a show.

In theory, sales should be better represented by casual indicators of popularity as costs get lower. In practice, the statistics are pretty garbled, though they do offer a hint as to which sorts of series may end up with bumps at the end of the day. To attempt to better understand the junk described above, I broke down 4 categories potentially indicating no-cost and low-cost popularity, and compared their ratings with the print-bump successes of series which got anime adaptations in Summer and Fall of 2013. Note that while I originally used Torne rankings in the earlier analyses, I discarded the data because of how incomplete they were.

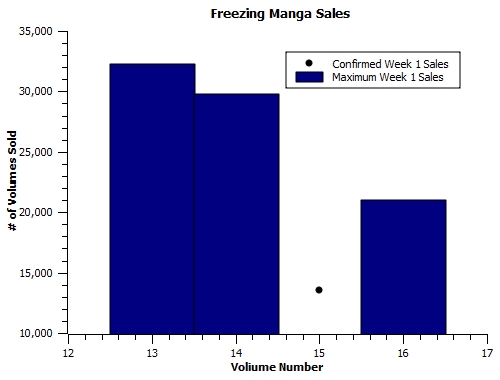
For the purposes of this article, a “significant boost” is one where a series experiences a 20% jump in sales or charts for the first time after the anime. All figures are for a volume’s first 2 weeks of sales, calculated with the average of the 2 most immediate before and after volumes, if 2 volumes of data are available in each case. Be aware that this is not a comprehensive measure of which series got boosts, just one intended to at least catch the biggest ones. 1/3 of all series got such a visible bump, meaning the null-hypothesis accuracy rate these indicators need to beat is 66.6%~67%.

In addition to the previous top 5/10/15 tests used for v1 disk sales, I’ve also included histograms of how successful series were scattered across the indicator. Ideally, they would all be 60th percentile or better, but reality isn’t quite that nice.

Continue reading

Fun With Numbers: Anime as Manga Advertisments in 2013

The commercial impact of anime goes well beyond its disk sales. Manga may sell to more people, but anime is extremely visible, airing on TV (albeit often late at night) and propagating around the internet at a very rapid pace. This visibility very often can lead to an increased strength of the franchise in general, propping up sales of print material, figures, and any various other related goods. Sometimes, anyway. 2013 was no exception, and saw a number of manga adaptations have anywhere from minimal to explosive effects on the sales of their source material.

I collected the manga sales history, including thresholds for series which charted sporadically, on this doc, and plotted it below. Note that these sales are not total, but the total number reported in a roughly fixed time period. Comparing sales tail length is a whole other issue, and I’m trying as much as possible to compare like figures.

One important difference from similar breakdowns of 2011/2012 series is that here I’ve opted to use the total sales from a series’ first 2 weeks of release (the highest reported total in that time interval), to attempt to minimize the effects of a bad split in creating artificial variations. It’s still an issue either way, but the difference between 9 and 14 days is a lot less than the difference between 2 and 7 days.

Two important series-specific notes prior to the plots. First, Maoyu is plotted here, in the manga section, because the manga charts more consistently than the light novel did and, more importantly, has available data from both before and after the anime aired (the LN ended just prior to 2013). Second, I can’t parse impact for series that don’t have at least one volume which released after the anime began to air. I thus will not be covering Servant x Service here, though there is data available. I will cover it in an addendum post come September when volume 4 has been out for 2 weeks.

Continue reading

Fun With Numbers: (Admittedly Arbitrary) Qualifications for Significant Print Sales Boosts

I’m about to dive headfirst into the manga/LN print data I’ve gathered and check how much the series that got adaptations benefited from them. It’ll take a week or so, but when I’m done, I’ll have charts like the 20112012 ones and a wealth of organized first-two-weeks data to cross-reference with the casual-indicators checks I’ve been doing, and I should be able to more or less finish that project. Before I do that, though, I just want to outline some guidelines I’ll be using for said project before actually gathering the 2013 print data.

One of the key problems I bumped into early on was how to classify boosts as big/small/significant/what have you. It’s a complicated issue that in practice goes far beyond the Oricon charts, but for the purposes of this project, I’m going to focus primarily on chart-visible boosts. These get split into two categories; one, the type where a series makes the charts for the first time post anime, and two, the type where a series sees a sharp uptick in post-release sales. After looking into the previous year’s record, I decided on different criteria for each.

I’m going to consider first-time charting significant if a previous volume was released under a threshold that would not have prevented the first-time-on-charts total from charting. In other words, most series charting for the first time will make this cut, but it’ll disqualify series like Freezing that charted under these ridiculously friendly circumstances:

Freezing-manga2I’ll consider boosts for series consistently on the charts significant if a series sees a 20% uptick in first two weeks of release sales from the immediate pre-anime period to the immediate post-anime period (averaged over 2 volumes, if possible). Even if the effects of anime adaptations extend well beyond this limited scope, I hope this will at least be indicative of which series made the very best of their source material boosts.

Also, I’m going to avoid analyzing series that lack post-anime releases (Servant x Service) or pre-anime releases (High Speed). For obvious reasons, both before and after data are necessary to identify a boost.

Weekly Manga Sales Charts for 2014

These are the weekly manga sales charts for the first four months in 2014, via myanimelist news, continued from the 2013 post. I’ll be doing one of these updates every 4 months; if you want more recent data, there’s plenty of places where charts are available (eg. ann, the mal news forum I get them from).

Edit: Added data through August 2014.

Edit 2: Added data through December 2014.

Continue reading

Fun With Numbers: Yuruyuri and the Oricon Threshold Iceberg

Towards the end of 2011, the chief editor of comic Yuri Hime, Naitarou Nakamura, revealed that Yuruyuri, a then-7-volume manga series which was adapted into an anime series in summer of that year, had sold over 1 million copies. That in itself isn’t a particularly rare feat; 49 different manga sold that many copies in 2011 alone, as did 15 individual volumes.

What makes Yuruyuri’s case particularly instructive, though, is that it had never appeared on the Oricon charts until June of 2012, 6 months after hitting said million copy mark. How is it possible that a series can hit that impressive a milestone without charting once? The short answer is that the Oricon charts are a very incomplete list. In the past 5 years’ worth of manga charts, we’ve never had a threshold that was below a five-digit number of copies. That means that, in theory, it’s entirely possible (if not extremely likely) for a series to sell 10,000 copies per week without its fans hearing a word about it. If this hypothtetical volume did that for 52 weeks, its total sales of 520,000 volumes would be 25,000 copies shy of the last series on the 2011 top 50 individual volumes list (One Piece’s first volume).

The above example is a bit extreme, but Yuruyuri’s performance isn’t that far off. There is a fairly strong limiting case we can look at to get an idea for how exactly Yuruyuri made it to the magic million (which required an average of ~143,000 copies sold per volume);  Assume the sales were entirely fueled by the anime’s popularity boost. The series had 7 volumes out for the period between the anime airing (on July 4th). Between July 4th and December 18th, there were a total of 24 weeks of Oricon sales charts. 1,000,000 copies/7 volumes/24 weeks=5950 copies/volume/week. The lowest threshold over that time period was 18,406 copies/week for one week in mid-October. Even if we assume that all of those sales were packed into the 12 weeks in which the anime was airing, that’s only up to about 11,900 copies/volume/week, still short of the most generous available threshold over that time period. In a less stringent case, if the manga was already half of the way to a million copies and the anime provided a more moderate boost (which would still have been doubling the series’ sales in a quarter of its previous 2 years in print), it would have been even easier for the series to remain entirely under the radar en route to the million-copy mark.

Yuruyuri had a successful anime, averaging about 8348 disks per volume, and thus didn’t need the manga success the way a lesser series might have. But it does serve as one of the more powerful counters to the idea that the success of a anime in advertising a manga necessitates an appearance on the Oricon charts. It also illustrates the fact that, when actually see big boosts in sales, those might be significantly bigger than just what we observe. The most successful manga advertisements, the crazy-chart Blue Exorcists, are easy to quantify. However, many series, even those that end up as clear-cut successes from an insider’s point of view, are not.* One thing that should always be kept in mind, especially when looking at manga for adults like Aoi Hana that packs a per-volume price tag (~1030 yen) twice that of newer One Piece volumes (~430 yen), is that a series doesn’t have to be making the Oricon charts at all to make its publisher happy.**

*I am guilty of oversimplifying these cases myself at times, so I can’t really blame other people for doing so. To wit, the gain-probabilities I name in this article are for minimum gains, not exact gains.

**Yuruyuri, by the by, runs about 930 yen/volume.

Fun With Numbers: The West-Side All Stars

Something I stumbled onto a while a go that made me curious was a seemingly non-trivial connection between myanimelist popularity in the sales boosts of both novels and manga attached to a given anime, which led me to some speculation as to how different Western and Japanese fanbases’ preferences really are.

This time, I’m taking a look at a similar question; how many shows with high levels of Western popularity truly bomb in Japan? To answer this, I took the TV shows in the top 200 most popular on myanimelist, and excluded the ones attached to any series that averaged over 4000 in disk sales, or had a novel or manga chart in its first two release weeks at 20,000 copies or more. What remains is, theoretically, a list of the series which failed to catch on in Japan despite catching on in the West.* Data via myanimelist, someanithing, and the Japanese BD/DVD sales wiki. Note that I count the box releases as part of the disk average for pre-millenial series.

Continue reading

Unstoppable Hype Machine Spring 2014 #5 – Stardust Crusaders

Download it!

Given our reputation of being JoJo lovers, number five wouldn’t be hard to predict. It’s part 3, Stardust Crusaders, and Animetic’s stand, Unstoppable Hype Machine, is ready to show you why! Let’s go!