Here’s the usual infodump post of initial numbers for the series whose June amazon ranks I’ll be tracking, gathered from this list of upcoming releases. As before, May data is still being collected and will be posted when that’s done in about a week.
Category Archives: Fun With Numbers
Fun With Numbers: Anime as Light Novel Advertisments in 2013
While light novels work a bit differently from manga in several key ways (stronger second-week showings, lower thresholds, etc.), they similarly often see big boosts after and presumably due to from anime adaptations. I collected the light novel sales history of the series to get anime adaptations in 2013 on this doc, and plotted them on the charts below, to illustrate which series did and didn’t get visible boosts.
This post doesn’t cover series with no post-airing releases (Maoyu, Uchoten Kazoku) or no pre-airing releases (Free/High Speed).
Fun With Numbers: Anime as Manga Advertisments in 2013
The commercial impact of anime goes well beyond its disk sales. Manga may sell to more people, but anime is extremely visible, airing on TV (albeit often late at night) and propagating around the internet at a very rapid pace. This visibility very often can lead to an increased strength of the franchise in general, propping up sales of print material, figures, and any various other related goods. Sometimes, anyway. 2013 was no exception, and saw a number of manga adaptations have anywhere from minimal to explosive effects on the sales of their source material.
I collected the manga sales history, including thresholds for series which charted sporadically, on this doc, and plotted it below. Note that these sales are not total, but the total number reported in a roughly fixed time period. Comparing sales tail length is a whole other issue, and I’m trying as much as possible to compare like figures.
One important difference from similar breakdowns of 2011/2012 series is that here I’ve opted to use the total sales from a series’ first 2 weeks of release (the highest reported total in that time interval), to attempt to minimize the effects of a bad split in creating artificial variations. It’s still an issue either way, but the difference between 9 and 14 days is a lot less than the difference between 2 and 7 days.
Two important series-specific notes prior to the plots. First, Maoyu is plotted here, in the manga section, because the manga charts more consistently than the light novel did and, more importantly, has available data from both before and after the anime aired (the LN ended just prior to 2013). Second, I can’t parse impact for series that don’t have at least one volume which released after the anime began to air. I thus will not be covering Servant x Service here, though there is data available. I will cover it in an addendum post come September when volume 4 has been out for 2 weeks.
Fun With Numbers: (Admittedly Arbitrary) Qualifications for Significant Print Sales Boosts
I’m about to dive headfirst into the manga/LN print data I’ve gathered and check how much the series that got adaptations benefited from them. It’ll take a week or so, but when I’m done, I’ll have charts like the 2011–2012 ones and a wealth of organized first-two-weeks data to cross-reference with the casual-indicators checks I’ve been doing, and I should be able to more or less finish that project. Before I do that, though, I just want to outline some guidelines I’ll be using for said project before actually gathering the 2013 print data.
One of the key problems I bumped into early on was how to classify boosts as big/small/significant/what have you. It’s a complicated issue that in practice goes far beyond the Oricon charts, but for the purposes of this project, I’m going to focus primarily on chart-visible boosts. These get split into two categories; one, the type where a series makes the charts for the first time post anime, and two, the type where a series sees a sharp uptick in post-release sales. After looking into the previous year’s record, I decided on different criteria for each.
I’m going to consider first-time charting significant if a previous volume was released under a threshold that would not have prevented the first-time-on-charts total from charting. In other words, most series charting for the first time will make this cut, but it’ll disqualify series like Freezing that charted under these ridiculously friendly circumstances:
I’ll consider boosts for series consistently on the charts significant if a series sees a 20% uptick in first two weeks of release sales from the immediate pre-anime period to the immediate post-anime period (averaged over 2 volumes, if possible). Even if the effects of anime adaptations extend well beyond this limited scope, I hope this will at least be indicative of which series made the very best of their source material boosts.
Also, I’m going to avoid analyzing series that lack post-anime releases (Servant x Service) or pre-anime releases (High Speed). For obvious reasons, both before and after data are necessary to identify a boost.
Fun With Numbers: Myanimelist Stats’ Correspondence with the Summer 2013 Disk Over/Unders
Quick recap: I’m taking a look at various no-cost indicators of popularity for anime and their related goods. First, I’m checking how well they correspond to disk sales by checking whether different applications of that statistic beat the null “every v1 will sell less than 4000 disks” accuracy criterion for a given season (66% for Fall, 59% for Summer). Later I’ll check how well these indicators corresponded to boosts in manga/LN source popularity (for works that were originally LN/manga), to contrast their predictive abilities at both high-cost and low-cost levels of interest.
This entry covers the myanimelist rankings and popularity for the 34 Summer 2013 shows I’ve been looking at, with the title tweaked to reflect that these are the series rankings from several months after the series have ended. It shouldn’t be a huge factor; positions don’t shift radically that often, especially after a series is done airing (more research on that forthcoming). The data I gathered can be found here, and the results are shown below.
Compared to Fall, Summer showed a relatively weak performance by the mal metrics. The popularity component still does alright, but the the rankings consistently underperform the accuracy of the null hypothesis. This is more in line with what I would have expected going in; there’s a lot of evidence to suggest that casual audiences aren’t that different inside and outside of Japan, but there’s a very relevant degree of separation between casual audiences and disk-buying ones. Too, a series’ aggregate score being less important to sales is unsurprising, as the series profile of “publicly lambasted but successfully appealing to its target audience” is exceedingly common in any medium.*
*It’s a principle potentially less applicable with nico rankings because they represent the subset of people watching via nico streams, which can be a qualitatively different audience from one that DVRs episodes and/or stream through other services.
Fun With Numbers: Nico Stream Rankings Predicting Summer 2013 Disk Over/Unders
Quick recap: I’m taking a look at various no-cost indicators of popularity for anime and their related goods. First, I’m checking how well they correspond to disk sales by checking whether different applications of that statistic beat the null “every v1 will sell less than 4000 disks” accuracy criterion for a given season (66% for Fall, 59% for Summer). Later I’ll check how well these indicators corresponded to boosts in manga/LN source popularity (for works that were originally LN/manga), to contrast their predictive abilities at both high-cost and low-cost levels of interest.
Nico stream rankings are often discussed in the context of early-season indicators of disk sales, and my analysis of the Fall 2013 shows for which those numbers were available did show a bunch of different versions of the data proving more accurate than the null hypothesis. Adding another season should help control for any peculiarities with the Fall season.
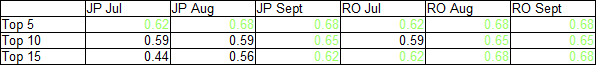
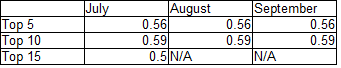
The accuracy rates for the top 5/10/15 models using only the 25 series Summer series with Nico stream data available, split into 3 averaged samples corresponding to the beginning, middle, and end (labeled 9-12, but occasionally 9-13 or 9-10) of the series. The individual rank data was compiled here, and the sorted version can be found here. The bare-bones summary of the results is below (green means an accuracy greater than that of the null hypothesis).
Note: the chart format groups by period, rather than by metric, as the Fall chart did.
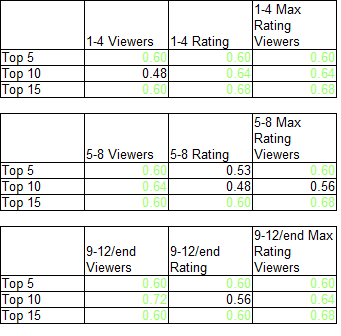
That’s a lot of green, corresponding to a fairly useful indicator. While there are notably some top-tier performances that failed to lead to disk sales (Watamote was top 5 in half the metrics, top 10 in all of them), the general results point to an indicator that can be fairly discussed early on as a broad-basis indicator of disk-buyer popularity.
Peculiarly, the max rating percentage becomes a less accurate indicator for the later periods. This appears to be due to the rise of specific shows (Genshiken Nidaime, Rozen Maiden’s reboot) that lost viewers while maintaining the number of viewers giving the max scores; most likely, many of the people who had middling opinions of them checked out after the first month, leading to somewhat inflated scores.
Fun With Numbers: Normalized Google Traffic Predicting the Summer 2013 Disk Over/Unders
Quick recap: I’m taking a look at various no-cost indicators of popularity for anime and their related goods. First, I’m checking how well they correspond to disk sales by checking whether different applications of that statistic beat the null “every v1 will sell less than 4000 disks” accuracy criterion for a given season (66% for Fall, 59% for Summer). Later I’ll check how well these indicators corresponded to boosts in manga/LN source popularity (for works that were originally LN/manga), to contrast their predictive abilities at both high-cost and low-cost levels of interest.
Google traffic offers a neat and fairly intuitive, if sometimes difficult to standardize, way of checking the popularity of shows, but it needs to be tested as much as any other stat. If you want to see the google data this check is based off of, it’s here. The doc where the checks were calculated is here, and the checks themselves are summarized below (numbers beating the null hypothesis shown in green):
While top 5 rankings bested the null hypotheses across the board, other more inclusive checks took a little while longer to become precise. It’s possible that that’s just some imperfections of the indicator showing, or that Summer saw more fluctuation in interest as the season wore on than Fall did.
Fun With Numbers: Torne DVR Rankings Predicting the Summer 2013 Disk Over/Unders
Quick recap: I’m taking a look at various no-cost indicators of popularity for anime and their related goods. First, I’m checking how well they correspond to disk sales by checking whether different applications of that statistic beat the null “every v1 will sell less than 4000 disks” accuracy criterion for a given season (66% for Fall, 59% for Summer). Later I’ll check how well these indicators corresponded to boosts in manga/LN source popularity (for works that were originally LN/manga), to contrast their predictive abilities at both high-cost and low-cost levels of interest.
I’ve already looked at the torne DVR ranks for Fall, now I’m doing the same for summer, where the accuracy of null hypothesis test is 59%. The results are listed below, with the lists and detailed breakdowns here. Less than 15 shows made the rankings for August and September, so I didn’t do a top 15 check for those two.
Despite some changes in what the top 5/10 were, none of these selection criteria did better than the null hypothesis, which is a pretty bleak sign for the rankings as a disk-sales picker given its middling Fall results (though obviously the jury’s still out on manga/LN boosts).
Fun With Numbers: Normalized Google Traffic for Summer 2013 Anime
I’m going to be doing the over/under 4k v1 data for Summer 2013 before I take a look at how the various indicators stacked up against source material boosts for manga/LN adaptations. The rationale there is that it’d be good to have at least two independent sets of data to crunch before I start getting tempted to draw too-sweeping conclusions from one set that don’t hold up as well over the long haul.
Anyway, here are the normalized monthly google trends traffic results for the Summer 2013 anime with v1 data I’m going to be looking at. It’s similar to the fall data, except now normalized to the term “Summer 2013 Anime” in July instead of the term “Fall 2013 Anime” in October (though believe it or not, the ratio is 1:1 for this particular pair). The list of queries I used to get this data (for both Japanese and Romanized franchise titles) is on this doc, and is shown below.
*Japanese and Romanized titles are the same.
**Japanese search term is “Free!” (largest volume does come from Japan over the Summer season), Romanized search term is “Iwatobi Swim Club”. Turns out a lot of people want free things on the internet.
***Took the best of long and abbreviated titles (eg Stella Jogakuin Koutou-ka C³-bu, C3-bu) because many results weren’t showing up at all. Turned out it didn’t make a ton of difference. That and Kanetsugu to Keiji had the only Japanese results out of either season examined to not crack 0.10.
Fun With Numbers: Game Time (in Anime)
There’s been plenty of talk, both here and elsewhere, about the difficulty of adapting games and/or how often game adaptations go bad. One of the most oft-cited problems with anime-game adaptations is the pacing, or more specifically how rushed many game adaptations feel. Well, while pacing is a complicated question and slower/faster does not necessarily equal better, we can quantify a basic part of that phenomenon; does a particularly low ratio of anime runtime to game playtime adversely affect the series’ sales?
First, though, it would help to know; what is a typical ratio of anime runtime to game playtime? Between gamefaqs (user-submitted averages) and vndb (ranges of playtimes), I was able to put together a fairly complete list of approximate hours taken to complete the 16 VN and console games adapted into anime in 2011 and 2012 (chosen because I’ve already done some research on those and had them available). I then compared that value for each show to the number of hours (assuming ~20 minutes per episode) allotted to its anime adaptation. For these 16 games, there was an average of 0.13±0.05 minutes of anime for every minute of game playtime, and most series fell within that range (the lowest ratio was Hoshizora e Kakaru Hashi’s 0.04, the highest was Hiiro no Kakera’s 0.21). Turns out, there was a pretty interesting (though it is perhaps just a product of small sample size) relation which fell out of plotting the ratios against another well-known quantity – disk sales averages:
Specifically, it seems that, while there is a lot of variance for any given range of A/G time ratio, there are no 10k+ hits with a ratio lower than 0.1. The sample is small enough that I don’t want to say too much about this at the moment, but if this holds up in other years, it could be a definite point in favor of the argument that game adaptations that face extremely uphill battle in squeezing in content are more likely to fail (or less likely to hit) than those with a little more leeway in terms of allotted airtime.
