Fun With Numbers: Anime as Light Novel Advertisments in 2011

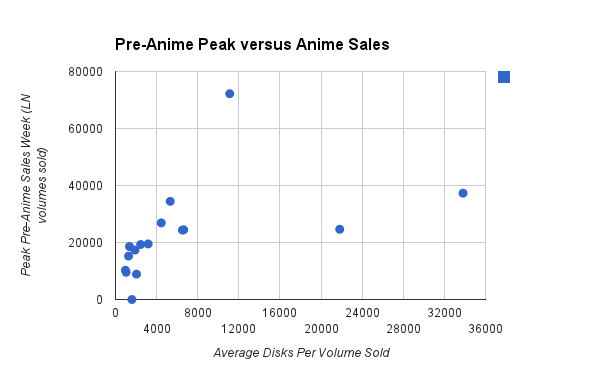
Despite the fact that both get released in compiled volumes costing somewhere between 400 and 1000 yen a few times a year, the market for manga differs in many ways from the market for light novels. For one thing, it’s a much smaller scale market; the most popular light novels sell hundreds of thousands of copies immediately after their release, rather the millions that One Piece/Fairy Tail/Attack on Titan bring in. Too, light novel adaptations tend to succeed much more as a function of their initial popularity than manga does. To get an in-depth look at how anime adaptations of light novels have impacted the source material, I’ve plotted the sales for their first two weeks of solicitation over time, with the airdate of the anime superimposed. See this doc for the raw data, and compare the 2011 data for manga adaptations.

Note: I plot the two-week totals, rather than the one-week total, because even the average the first week total is vulnerable to a series that comes out on the last of the Oricon tracking period and having its sales numbers hamstrung. Kore wa Zombie Desu Ka had 4 volumes in a row come out on the last day of the week, obscuring a very real anime-fueled boost in sales.

Continue reading

Fun With Numbers: The Bimodal Nature of Light Novel Adaptations in 2011

The sales levels of anime adaptated from manga are basically a crapshoot. Not so much Light Novels. Though I still haven’t compiled at the 2012 data, but one particular bit of information popped out of the 2011 sample that it deserves its own individual mention. It’s best described as 2 rules of thumb:

1. No LN series that had at least one week where a volume sold 20,000 copies in that week (disregarding cumulative totals) that went on to sell less than 4000 disks per volume. Only one (Mayo Chiki) sold less than 5000.

2. No LN series without at least one week where a volume sold 20,000 copies sold more than 4000 disks per volume. Only one (Kore wa Zombie Desu Ka?) sold over 3000.

LN_Peaks

Continue reading

Fun With Numbers: The February 2014 Amazon Experiment (Initial Numbers)

I present few results here; I’m mainly just laying the groundwork for something I hope will bear fruit at the end of the titular month.

As you may know, I’m very interested in the intricacies of the market for Region 1 anime releases, and I’ve looked at the problem from a few different angles. There are sources for this sort of thing, but I’d rather start building a cache of available numbers than just rely on word from ANNCast, likely reliable though it is, that certain series did “well” or “break-even”. This post is the raw beginnings of an approach on this problem, though at this phase of things I’m mainly interested in finding indicators that seem accurate.

Continue reading

Fun With Numbers: Correlation Coefficients for Manga Sales Boosts and the Kickstarter Analogy

Let’s say, for the sake of argument, you’re a fan of Attack on Titan. You watched the entire show as it aired and can’t wait for more of it. What if, tomorrow, a Kickstarter went up for a 12-episode second season of the show. How much, without knowing the reward tiers, would you give? $1? $10? $20? $50? $100 (like the U.S. disks for season 1 as a whole will likely cost)?

I’d imagine that, depending on just how much they enjoyed AoT, most people would answer with a number within their price range. Given the popularity of the show, such a project would be a fairly safe bet to break the current record for animation projects on the site (currently Bee and Puppycat’s $872,133).

But let’s make a key change to this project. Let’s suppose that, instead of a give-what-you-can model of pricing, this hypothetical Kickstarter only allowed pledges at or above $500 level. Even for a series with a lot of enthusiastic fans, I’m willing to bet that turns some of them off. Even if that $500 level includes a meet-and-greet with the anime’s entire cast and signed copy of volume 1 of the manga, that’s just more than what many people are willing (or able) to pay. And that is the crux of the matter when it comes to discussing who buys anime.

Continue reading

Fun With Numbers: Guesstimating the Break Even Point of English Dubs

If you’re familiar with the Japanese anime sales figures I sometimes look at, you may be aware of something called the break-even point, a rule-of-thumb figure that sets a general line between profit and loss for a given show at 3000 disks sold per volume. (The math is fairly elementary. At 10 million yen per episode, 12 episodes cost ~120 million yen. Selling 3000 copies of 6 disks at 7000 yen per disk nets a gross profit of 126 million yen. While that number varies depending on things like show budget, alternative income sources, and how many episodes are packed into a volume, it’s good to have a rough number in mind because it sets a scale for what constitutes success and failure for a show. But what does that number look like for the U.S., and what does that say about the comparative purchasing power of western fans in general?

Continue reading

Fun With Numbers: Anime as Manga Advertisments in 2012 (and their respective myanimelist ranks)

Update 2 (July 15, 2014): New, more accurate data is here.

Update (Jul 1, 2014): This post doesn’t measure releases in 2-week totals, which turns out to be a huge deal in many, many cases. I’m currently working on an updated version of both this and the 2011 data. Just be aware of that before citing the data from here regarding any one show.

By all rights, a 30-series sample like the one I had for 2011 was enough to get most of the relevant information regarding how anime boosted manga sales. However, during that analysis, I bumped into an incidental correlation, myanimelist ranking versus gain in manga sales, that was far too juicy to ignore. If that correlation is real, it points to a very tangible link between the Japanese mainstream community (who have enough disposable income for manga but not for anime) and the English-speaking online community (who generally pay a comparable pittance, if anything, for the anime they watch). But I couldn’t be sure from just the 2011 data, since that was the sample that gave rise to the theory. So I did what any good researcher would do, and pulled another year worth of data to see how things would match up. The results can be found on this spreadsheet, and are sorted in order of descending myanimelist rank below.

Continue reading

Fun With Numbers: How Much Does Promoting Manga Help Anime?

Ever since Inu x Boku SS first drew my attention to the subject in June of this year, I’ve been quite interested in the concept of anime in the context of its broader commercial impact. It’s not exactly counter-intuitive to point out that anime doesn’t get made in a vacuum where disk sales, important as they are, are the only thing that determine the success or failure of a project. There are many factors that play into that equation; licensing cash, character goods sales, TV ratings, etc.

But manga sales are particularly interesting for two reasons. First, we can track them fairly easily; animenewsnetwork keeps English-language versions of the weekly Oricon rankings of manga that date back to 2008, so there’s a lot of baseline data that we can compare with newer series. So when Blue Exorcist did Blue Exorcist things…

FWN-BlueEx-1

…it’s pretty obvious where the cause lies. Second, because the increase in sales per volume can potentially be really high (see above chart), it’s sometimes worth it for manga publishers to take a gamble and partially fund an anime adaptation. While such funding isn’t going to pay for most anime by itself, readers of this blog will be aware of the tangible influence of marginal increases in financial stability.

What follows is an analysis of how manga to get an anime adaptation in 2011 fared overall at the marketplace, with a look at when and why publishers chipping in for an adaptation ala Shonen Sunday in 2013 is a good business move in theory (while still hinging, as everything ultimately does, on competent execution).

Continue reading

Fun With Numbers: Anime As Manga Advertisments in 2011 (Part 2: The Upper-Limit Baselines)

Update 2 (July 15, 2014): New, more accurate data is here.

Update (Jul 1, 2014): This post doesn’t measure releases in 2-week totals, which turns out to be a huge deal in many, many cases. I’m currently working on an updated version of both this and the other 2011-2012 manga boost posts. Just be aware of that before citing the data from here regarding any one show.

Way, way back, I published an article looking at how anime adaptations produced in early 2012 affected the sales of their source manga. It was interesting data to take a look at, and it was interesting to see which anime really boosted the manga sales. Long story short, there are cases where a manga really jumps from mid-tier to franchise level (Space Brothers, Kuroko’s Basketball, Inu x Boku SS) soon after the anime airs, and cases where the anime doesn’t have much visible effect.

Also way back, I started pulling sales records for manga that had an anime adaptation air in 2011, to get a better idea of how the two media are interrelated. This post contains the second half of that data, specifically the data for which I have maximum constraints for series before they aired, and at least one solid instance of making the Oricon charts afterwards. These aren’t quite the tier of hits in the first part of the data, but they’re more marginal, which makes the charts pretty interesting by themselves.

Continue reading

Fun With Numbers: The Anime Sequel Probability Equation (Alpha)

Ever wonder what anime get sequels and what don’t? The simple answer to this fairly simple question is “sales, plus a few mitigating lesser factors”. We know this, beyond the obvious intuition, because over the years, we see those with robust sales totals get continued much more often than those with lackluster ones:

FWN-Sequel-B-SalesA more interesting question is perhaps this; which anime this year have the best chances of getting continued? After some delving into the subject, I can finally answer this question to a respectable degree of confidence. Based on data from 615 shows airing from from 2005-2012, the first season of an anime which sells x units per volume has P odds of getting a sequel, meaning either a second season or a movie.

P(x, t, L)=.01+θ(x-2250)*(.7-1650/(x+L*750))*e^(-((t-1)*θ(t-1))/.7)

Where t is the time in years passed since the first season aired, and L=1 corresponds to the series having been licensed. θ is the step function, 0 when the number inside the brackets is less than 0, and 1 when the number inside is greater than 0.

Continue reading

Fun With Numbers: Explaining Why Unpopular Anime Get Sequels

If there’s an inverse situation to not seeing a sequel to something you liked that you know was really popular, it’s getting a sequel when you in no way expected one. Disc sales are a pretty good indicator of when something is commercially viable enough to get a second season, but they aren’t the only factor playing in. There are a couple of consistent ways that anime with non-profitable sales wind up with more than one season, and that’s what I’m looking at today. Examination of the ones that did sequel reveals a rather unsurprisingly grim prognosis for fans of old, poorly-selling shows hoping that they’ll get more.

Continue reading